Bitcoin Long-Term Price Theory No One Considered
Bitcoin Long-Term Price Theory No One Considered

Depending on who you ask, there are differing opinions on the future direction of the cryptocurrency market; specifically, Bitcoin.
Some folks say that we’re right on the precipice of ending the bear market and going on a bull run for the next few months, the likes of which will bear a close resemblance to what was experienced during the 2017 holiday stretch (October to December).
Others predict that Bitcoin’s bear market is just beginning, and that there’s a strong chance there will be several more precipitous declines in the price before it truly hits its ‘bottom’, which will be followed by a lengthy recovery period before any such bull market will be experienced again.
And of course, there are the ‘permabears’ that believe that it’s only a matter of time before everyone wakes up and decides that Bitcoin has absolutely no inherent value while there are permabulls on the other side of those permabears that claim that its only a matter of time before every fiat currency eventually goes bust and Bitcoin becomes the only money that’s accepted.
While this theory makes no assumptions and, it’s just that, a theory — we’ll stick to the details of the potential implications of this price action.
What is a Rounding Bottom Pattern?

Great question.
Below, is an illustration:
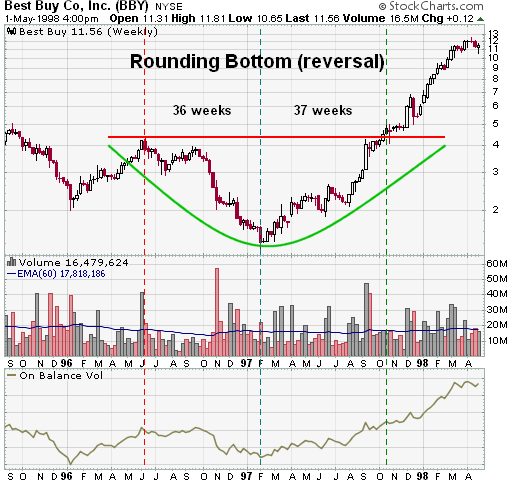
Above, you get the general gist of the rounding bottom pattern formation. It pretty much looks like one large cup (keyword: large).
Now, almost everything that we know about the rounding bottom chart formation is from observations and notes that have been taken on asset behavior in the traditional stock markets.
Unfortunately, due to the brief time span of cryptocurrencies trading with any notable volume of cash, we don’t have a lot of data on how rounding bottom patterns play out in the crypto world. But, we’ll assume for simplicity’s sake, that the pattern should behave the same way in crypto that it would in any other crypto.
Now, at this point, you’re probably asking yourself:
What’s So Special About the Rounding Bottom Chart Formation?
A few things:
- If this indeed is the chart formation that Bitcoin is in currently, that means that the end of the bear market is in sight. As for how long it would take for it to be officially ‘over’, is something that we’ll get into a bit later in this article.
- If this is indeed the chart formation, then we probably have enough data points to realistically predict when the market will recover.
- If this is the chart formation, then not only are #1 and #2 true, but the ‘worst’ of the bear market (if you’re a bull), is probably over.
Now, before we move on to explain why #1, #2, and #3 are true — let’s dig a little deeper into the Rounding Bottom Formation to give you all as readers a better idea of:
A) What qualifies a pattern as a Rounding Bottom Formation (No, it’s not as simple as you think it is)
B) How one should effectively trade a Rounding Bottom Formation (Once again, no, this is not as simple as you think it is)
C) What it really means if there truly is a Rounding Bottom Formation developing on Bitcoin
Understanding the Rounding Bottom Formation Chart Pattern
Most individuals are pretty solid visual learners. So before we start really dissecting the Rounding Bottom Formation, we will display a few more photos of rounding bottoms so that you can start to formulate an idea of what they look like and in what scenarios they typically occur in.
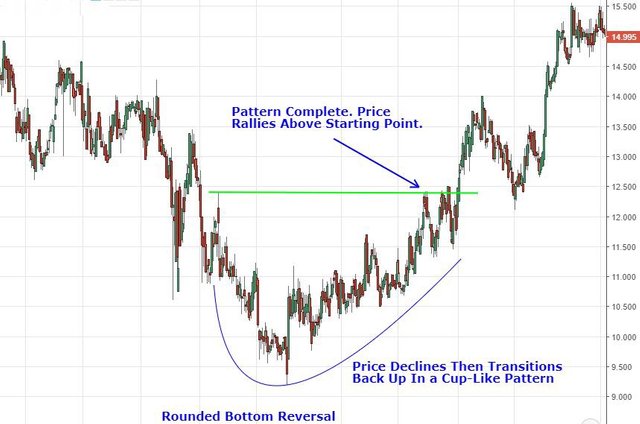
Source: https://www.investopedia.com/university/charts/charts10.asp
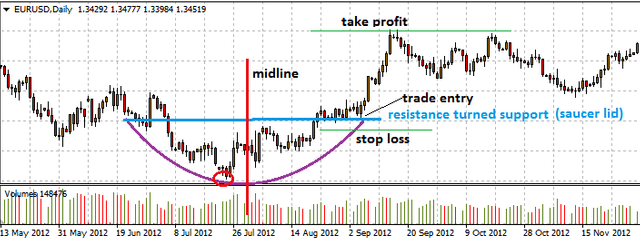
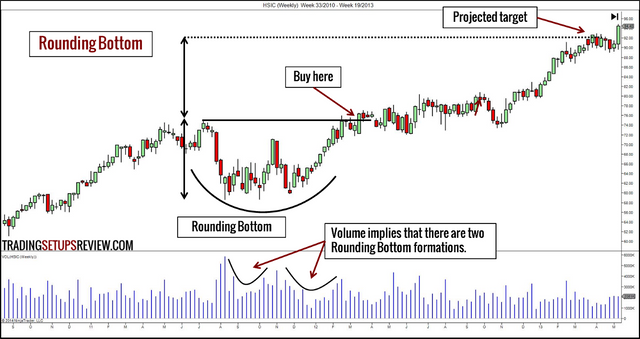
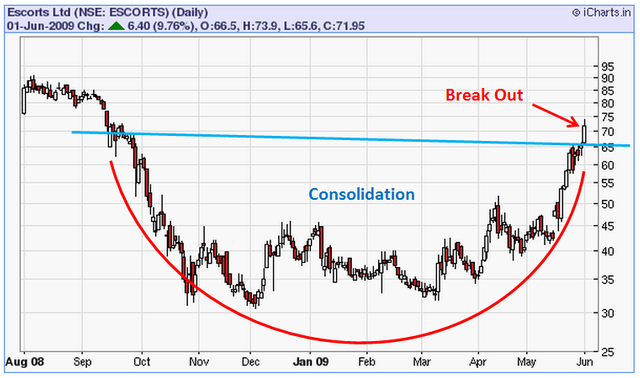
You probably get the idea by now.
Fact #1 — Rounding Bottom Formations Are Always Bullish
Because of this fact, you shouldn’t really stress whether you can discern if it’s truly a reversal or a continuation.
It makes no difference.
In either case, if this pattern formation has manifested and it is valid (not all chart patterns result in ‘completion’), one should expect the net result to be a substantial price gain.
Fact #2 — Rounding Bottom Formations Take a LONG Time to Manifest
The Rounding Bottom Formation is not something that is meant to be identified on a time frame that’s really any lower than the daily. Ideally, you’ll be confirming this with a weekly/4 or 5-day chart.
Fortunately for us, stockcharts has already thoroughly dissected what one should expect in terms of the length of a rounding bottom formation as well as the criteria that one should seek in identifying that a rounding bottom formation is truly forming.
In terms of time though, one should expect that this formula will take several months at the very least. Sometimes they took up to two years to complete (in the traditional markets at least).
Fact #3 — Volume Usually Mimics the Pattern
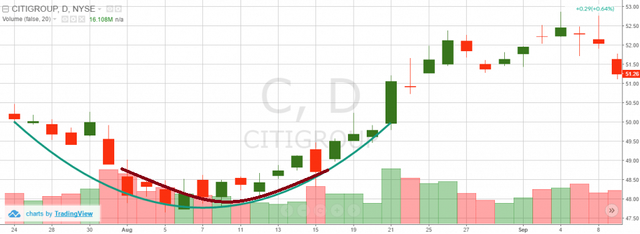
What this means, in a nutshell, is that you should be expecting the volume bars at the bottom of your chart to be forming a cup as well.
Check out this example below:
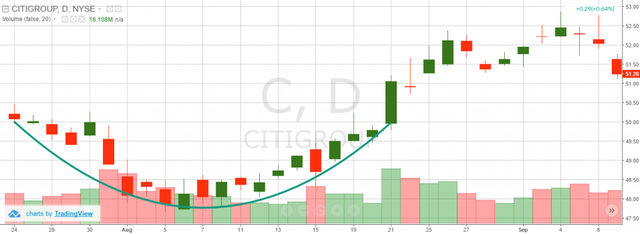
Source: https://tradingsim.com/blog/rounding-bottom/
There’s another bended line drawn over the volume as well to illustrate this a bit better:
Thomas Bulkowski’s Characteristics of a Rounding Bottom Formation

Yeah, this is really the best picture we could get of him ^
If you’re not familiar with an individual by the name of Thomas Bulkowski, you should try to change that at some point.
While his personal background/details are somewhat blurry, his work in dissecting chart patterns definitely isn’t. In fact, Thomas Bulkowski is what many consider to be an expert.
Thomas Bulkowski owns ‘thepatternsite’, which is what we’ll go to next in order to get a better idea of his hints/tips/tricks on trading the Rounding Bottom Formation Chart Pattern.
If you visit, http://thepatternsite.com/roundb.html , you’ll be taken to the entry for the Rounding Bottom Chart Formation.
Thomas Bulkowski’s Technical Assessment of the Pattern

With an average rise of 43% (from the top of the cup), and a break even failure rate of only 5%, it should start to become more readily apparent why a positive identification of a Rounding Bottom Chart Pattern Formation on Bitcoin would be significant.
Thomas Bulkowski’s Rules on the Rounding Bottom Chart Formation
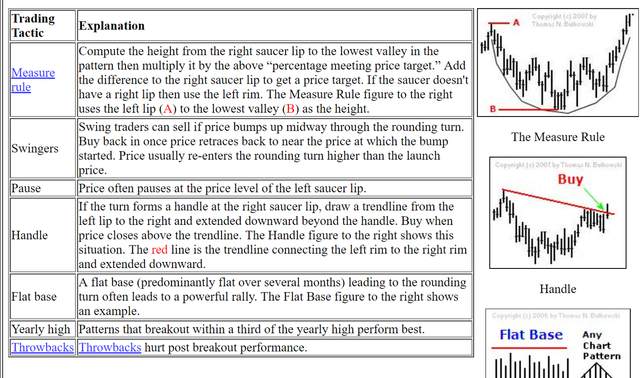
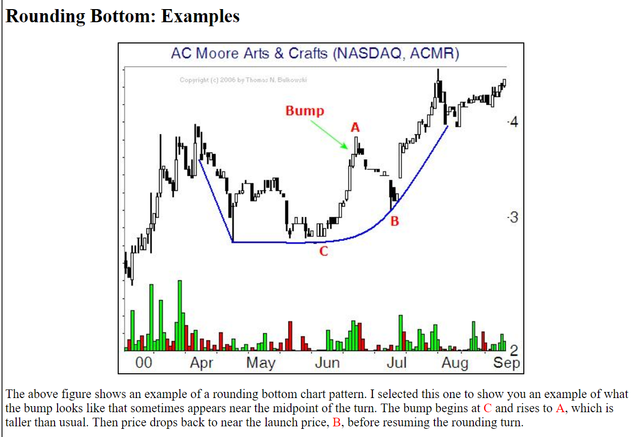
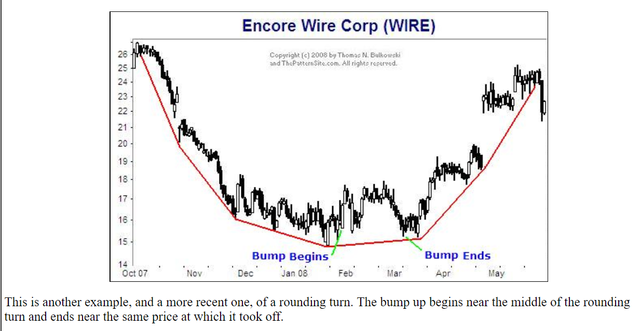
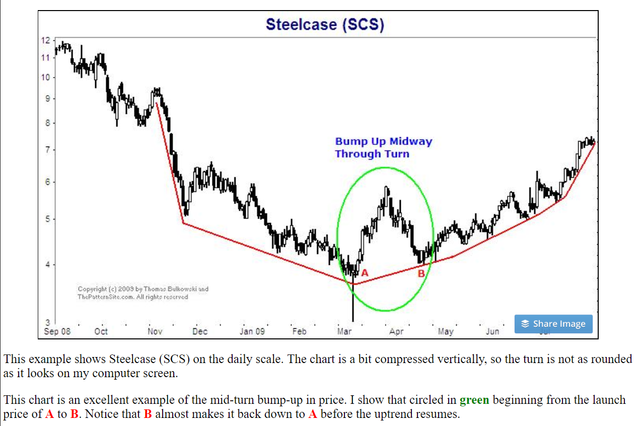
Note how there are different iterations of the Rounding Bottom Chart Formation itself that can sometimes occur. It’s important to be aware that there are some false jumps in the rounding bottom that are going to catch some traders off guard and result in a loss of funds.
Taking a Look at Bitcoin

Now that we’ve learned everything that we need to know about the Rounding Bottom Chart Formation, let’s see if we can see something similar beginning to develop on the Bitcoin chart.
Daily Resolution
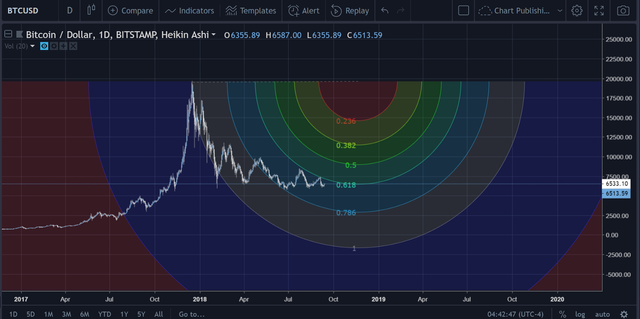
https://www.tradingview.com/x/Fs2zTGkU/
Now, before you say, “What the hell is this?”, check out the following explanation —
What you see on the chart above is something called the ‘Fib wheel’. The Fib Wheel (courtesy of TradingView), was applied on this chart to get a better idea of where we should start the rounding bottom chart formation.
Why?
Because of the design of the Fib Wheel itself. It virtually plots out various rounding bottom formation lengths (based on fib levels).
These different lengths are designed for products of varying volatility and price fluctuation.
The Ultimate Theory
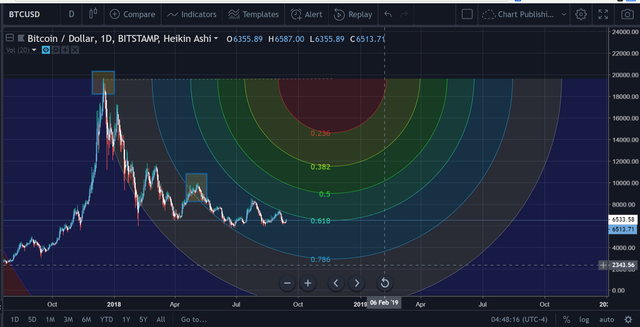
Everytime the price breaks into another channel, the Rounding Bottom Chart Formation (if it is indeed present), must be considered ‘restarted at that point.
Below are the marked restart points to help you out:
https://www.tradingview.com/x/OdAoS0VX/
So, only twice thus far — technically. These times are represented by the transparent blue boxes in the photo above.
As you can see, the latest blue box can be detected at the start of the .786 ring level of our Fib Wheel.
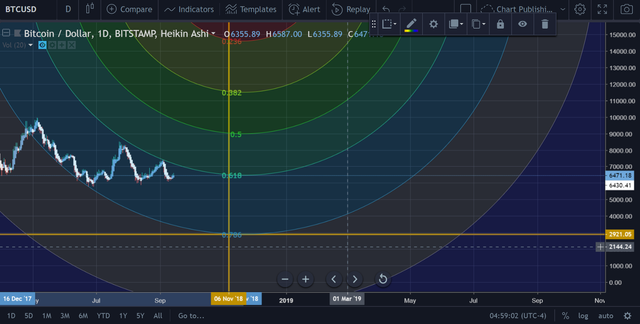
What the Wheel / Rounding Bottom Formation Predicts
https://www.tradingview.com/x/nDU5mGPE/
Based on the wheel is showing us here, the ‘low’ could potentially be at $2,921/Bitcoin.
This does not mean that it is an iron clad guarantee — the price could ‘dance around’ this $2.9k mark. But, at the very least, assuming that the price remained in this channel without breaking south or north, it will eventually touch down somewhere around $2.9k.
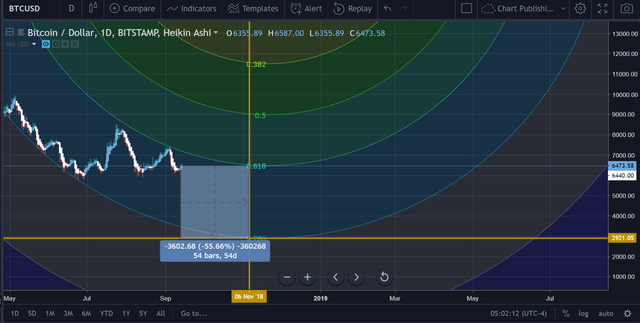
The chart shows that this would occur at some point around the beginning of November. While this is not unreasonable by any means, the price is a significant ways away from that point currently:
https://www.tradingview.com/x/zyA50yDd/
If the price did touch this point, it would represent a 55.66% loss in price in a little under two months from this present point.
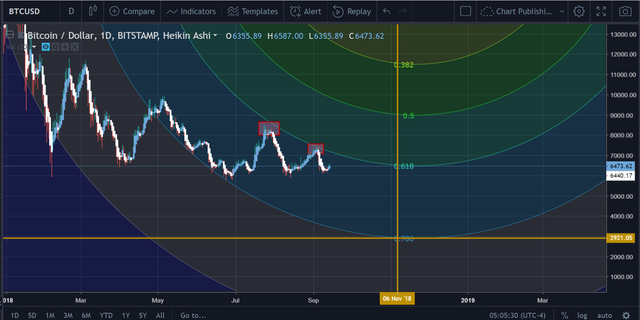
However, Bitcoin is no stranger to such drops, and there’s a chance that it could eventually backslide in price again as it tests the top of the rounding formation’s ‘range’ (what would essentially break the pattern altogether).
https://www.tradingview.com/x/x68NyuM0/
The two red boxes in the chart above show that the price has been duly rejected twice when it has attempted to break through to the next Fib pattern/layer.
Currently, the overhead resistance is at $6.9k.
More Information About Our Daily Resolution Rounding Bottom

So far we know a good amount of inforamtion, but we don’t know everything we need to know.
Here’s a list of some important things to remember/consider:
Fact #1
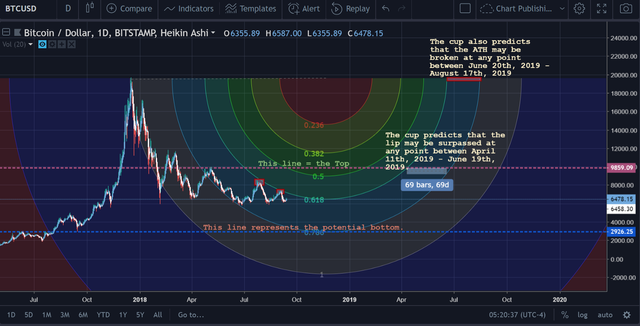
The ‘lip’ of the cup is at $10k.
Fact #2
The potential bottom is at $3k
Fact #3
The cup predicts that the lip may be surpassed at any point between April 11th 2019 and June 19th, 2019
Fact #4
The rounding bottom formation (as applied in this case), predicts that the ATH may be broken at any point between June 20th, 2019 and August 17th, 2019.
Here’s an illustration to reflect all of those ideas:
https://www.tradingview.com/x/d8YBk0fA/
Conclusion
Whether you believe in the Rounding Bottom Chart Formation is entirely up to you.
At this point, it’s not a verified chart pattern. This piece was simply to provoke some thought and cause some individuals to consider alternative scenarios to the ones that they may have in their heads currently.
If you notice, this theory dictates a price action that actually matches many of the more popular theories about Bitcoin’s price movement that are out there at this point in time.
Thus, it seemed worthwhile to put this theory out there to see if we can actually put a ‘face to the name’, so to speak.
As always, good luck trading! This is definitely not financial advice of any sort and you should be making your own decisions about how you’d like to go about things.
Disclaimer
This article is not financial advice. The author is not a financial advisor and this article was not paid for.
For more information like this, join/follow our Website, Telegram, Discord, Steemit, Reddit, and Twitter!
This Analysis Was Also Posted On:
Website = https://blog.zerononcense.com/2018/09/14/bitcoin-long-term-price-theory-no-one-considered/
Medium = https://medium.com/@proofofresearch/bitcoin-long-term-price-theory-no-one-considered-61deb9a2607c
TradingView = [https://www.tradingview.com/chart/BTCUSD/MtsbVZOH-This-Bitcoin-Formation-Predicts-When-the-Bear-Market-Will-End/](https://www.tradingview.com/chart/BTCUSD/MtsbVZOH-This-Bitcoin-Formation-Predicts-When-the-Bear-Market-Wi
This is gold stuff! Thank you!
...and follow.