Daily Update on Bitcoin
Yesterday I created a post about Bitcoin and my projections and analysis of what it might do in the coming days. So let's take a look at the charts and see exactly what is up with Bitcoin.
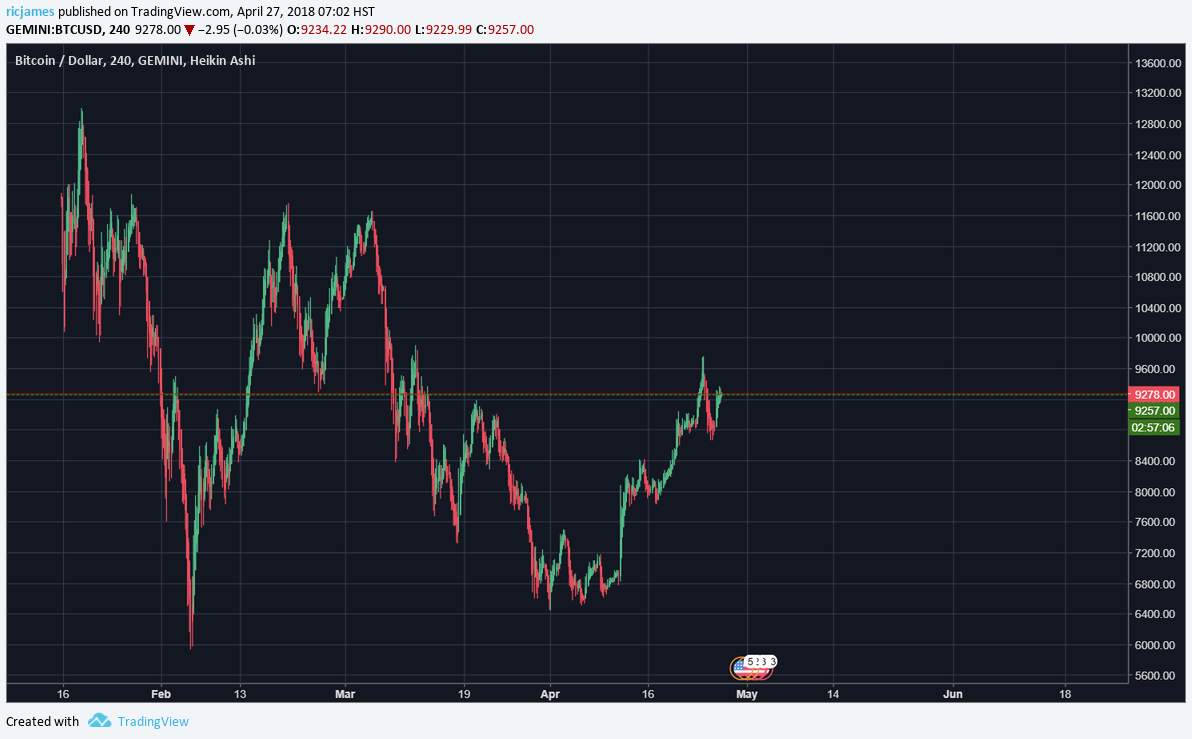
Below is the 4 Hour Chart on BTC:

As you can see, Bitcoin has been on a fast tract upwards after that long and tedious drop down. Since then we have seen very quick impulse moves followed by sideways consolidation patterns. Since the beginning of this move upwards, we haven't seen much downward action until 2 days ago where we saw a very sharp downward move that has since rebounded.

Now taking a look at an updated chart where I have added some trend-lines it looks as though we are trading within a large flat pattern. If that is the case which I believe it is, we should see this impulse move we are in take us all the way to the upward trend-line shown by the blue horizontal line. Take note that BTC does not HAVE to touch the line or stop before it. It is just there to show an area where Bitcoin is most likely heading towards. It could break through and go another $1000 higher, it could stop before $1000 short of the line.

So knowing that let us take a look at the current move we are in on a 15 minute chart. If we are expecting to see more upside to reach the top of the flat, then we should be looking at a continuation pattern and more upside on this chart. It looks as though we are creating a flat of some kind, possibly expanding, which more times than not is a continuation pattern.

Knowing this we should play the breakouts and be in the trade to the upside so that we can catch the possible upward move. I tossed FIB ratios out there to show an expected target of the end of this move which we could see.

Right now the risk to reward is not all that great at 2.61 but it is still over a 2 to 1 ratio. If you don't feel comfortable taking this trade wait to see if there is a pull back that will take us closer to the stop loss shown by the blue horizontal line and your R/R ratio will be much better.
I hope you enjoyed my analysis on Bitcoin. After the close of the NYSE I will post my update on the S&P 500 as well as who won the first ever weekly contest for the S&P closing price. For those of you who are new to my blog, I am starting a weekly contest where I will send a reward to the STEEMIAN who has the closest guess to the weekly close of the S&P 500. Right now the prize is .25 SBD but the more people who enter and the more support I receive the bigger the prize I will give out.
If you would like to check out some of my other posts, I will post them below as well as the contest details. I will also post the winner of the contest later today so stay in touch to see the winner.
As always have a great day and an even better one trading.
Other posts:
Weekly Contest: https://steemit.com/contest/@ricjames/weekly-s-and-p500-contest-april-27th
S&P500: https://steemit.com/steem/@ricjames/61yyvg-daily-update-s-and-p-500
Bitcoin: https://steemit.com/steem/@ricjames/bitcoin-primed-for-another-move-upward
Update:
Bitcoin is taking a plunge it took out the stop and now it is time to wait for this move to settle down.