Bitcoin Price Analysis: June 5th

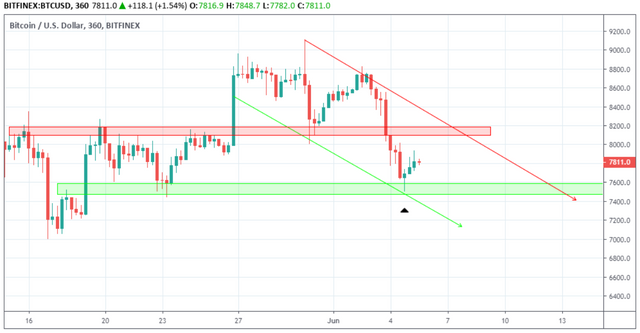
On May 30, the Bitcoin price reached a high of $9109.0. A rapid decrease was followed by an increase. On Jun 2, the BTC price reached highs near $8800. It has been decreasing since.

Bitcoin Price (BTC): Trends and Highlights for June 5, 2019
- The price of BTC/USD reached a top on May 30.
- It is trading inside a descending channel.
- There is short-term bullish divergence developing in the RSI and the MACD.
- The moving averages have made a bullish cross.
- There is support near $7600.
- There is resistance near $8200.
Descending Channel

BTC Price: Technical Indicators
The price of BTC is firstly analyzed alongside the RSI and the MACD, and secondly alongside the 10- and 20-period moving averages (MA) below:
On Jun 4, the Bitcoin price (BTC) made a low of $7770.00. It continued to decrease and made a lower low of $7501.00 the next day.
During this period, the MACD and RSI generated higher values. This is known as bullish divergence and often precedes price increases. In the case of BTC, it preceded the increase toward current prices.
Furthermore, on Jun 5, a bullish cross between the 10- and 20-period moving averages occurred.

This is often an indication that an uptrend has begun. However, both these occurrences are only visible in short-term time-frames.
We stated in our previous analysis that we believe that the BTC price is likely in a long-term downward move.
Therefore, this increase is only a short-term increase inside a long-term downward move.
Future Movement

The closest resistance area is found near $8200. We do not believe that the Bitcoin price will break out above this area.
Summary
The Bitcoin price is trading close to the support line of a descending channel. The technical indicators point to a short-term increase.
Do you think the Bitcoin price will initiate a short-term increase? Let us know in the comments below:
Posted from Bittabi Bittabi.com : https://bittabi.com/bitcoin-price-analysis-june-5th/
Warning! This user is on my black list, likely as a known plagiarist, spammer or ID thief. Please be cautious with this post!
If you believe this is an error, please chat with us in the #cheetah-appeals channel in our discord.