Strategy "Base 150"
Instruments: EUR/USD, GBP/USD, USD/CHF, USD/JPY.
Charts: H1, H4, D1.
Indicators:
MA(6);MA(35);MA(150);MA (365).
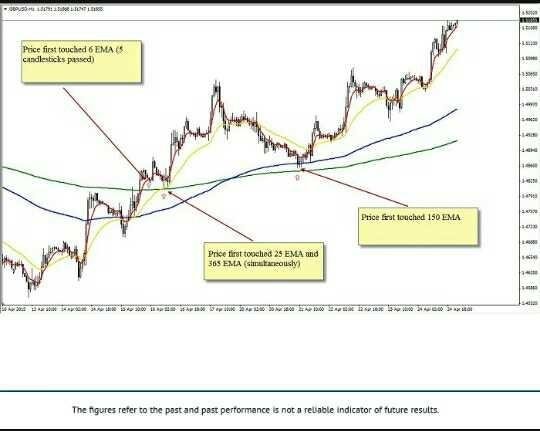
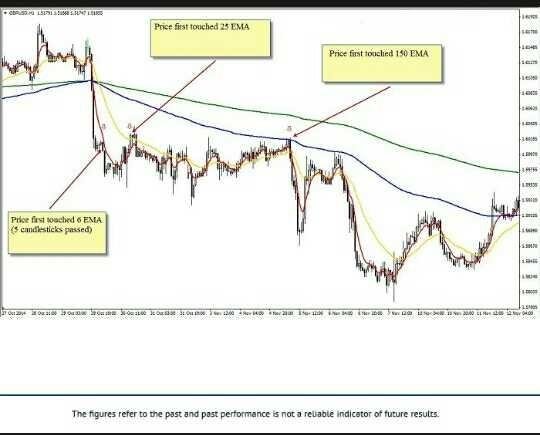
The point of the strategy is to spot early signs of a reverse and to open the position in the direction of a breakout. In order to determine the breakout 2 slow MA’s with 150 and 365 periods are used, and 2 fast MA’s with 6 and 25 periods are used to confirm a rebound.
When to open long positions:

The price broke out the slow MA;MA(6) is on the same level or above the slow MA;After the price touched the fast MA, switch to a lower chart and wait for a reverse signal. It should be noted that all other MA touches are not important, the position has to be opened only after the very first rebound;For example, after receiving the signal on the H4 chart wait for the confirmation on the H1 and open the position after a resistance breakout. Stop-loss is placed behind the local high. Usually, it is the high of the breakout candle. Take profit – two times longer than stop-loss.
When to sell:

The price broke down the slow MA;MA(6) is on the same level or below the slow MA;After the price touched the fast MA, switch to a lower chart and wait for a reverse signal. It should be noted that all other MA touches are not important, the position has to be opened only after the very first rebound;
For additional profit, a trailing stop option can be used that would allow to catch longer trends. Also, take profit can be placed at important support and resistance levels.
Source. Liteforex
Nice strategy
thx rolland
Hi! I am a robot. I just upvoted you! I found similar content that readers might be interested in:
https://mag.forumotion.com/p1007036-base-150-strategy