Trickle-Down Economics Must Die, Long Live Grow-Up Economics: The myth of inequality-driven economic growth and how to achieve real prosperity for all with UBI
“Economics, as it has been practiced in the last three decades, has been positively harmful for most people.” — Economist Ha-Joon Chang
For over thirty years we’ve treated something as fact which is actually false. Economists we trusted to know better, didn’t, and so people have suffered and continue to suffer. This pernicious economic myth is the absurd notion that a rising yacht lifts all tides, or as more popularly described, “trickle-down economics.” If we are to start running our economy in a way we could one day describe as notably less insane, we must finally come to see it for what it actually is.
An Undead Idea
This belief that it’s good economics to give a relatively greater and greater share of the pie to the top of the economic spectrum because the absolute sizes of all remaining shares will grow, has taken some mortal hits in recent years by some major players, most notably even the OECD and IMF. In fact, it has now reached the point that the idea even being left alive at all in the minds of anyone, makes it a good candidate as an extra in The Walking Dead.
Surveying the data, we’ll start with Wall Street bonuses versus the economic multiplier effects of higher velocity money, go on to economic growth research in relation to distributional inequality, and end with what we know from global cash transfer evidence and the economic effects of billionaires. Let’s burn this undead idea of inequality-driven economic growth with napalm and bury it in concrete shall we?
Section 1: Multiplication
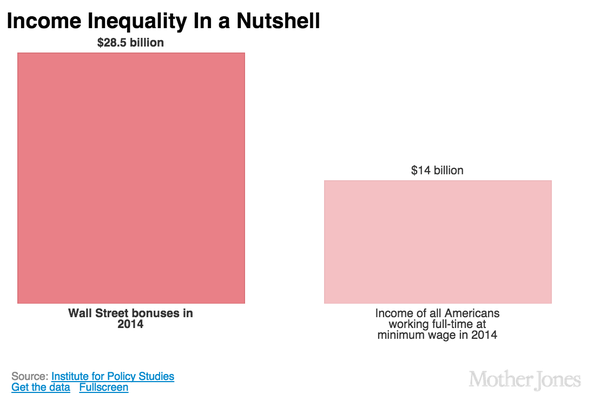
After looking at some numbers, Mother Jones back in March 2015 tweeted a memorable chart along with possibly an even more memorable comment.
This is one of the most fucked up charts you will see in the foreseeable future http://t.co/BlHNmufut0 pic.twitter.com/utvG1squcQ
- Mother Jones (@MotherJones) March 16, 2015
This chart alone is perhaps enough to warrant a trip to the nearest window to shout out, “I’m mad as hell, and I’m not going to take this anymore!”
Wall Street earned twice as much in year-end bonuses alone as all full-time minimum wage workers combined earned the entire year.
What Mother Jones neglected to mention however is something that goes well beyond “fucked up”, and something which did not go unmentioned in a piece by the Institute for Policy Studies after identical news the year prior.
Every extra dollar going into the pockets of low-wage workers, standard economic multiplier models tell us, adds about $1.21 to the national economy. Every extra dollar going into the pockets of a high-income American, by contrast, only adds about 39 cents to the GDP. These pennies add up considerably on $26.7 billion in earnings. If the $26.7 billion Wall Streeters pulled in on bonuses in 2013 had gone to minimum wage workers instead, our GDP would have grown by about $32.3 billion, over triple the $10.4 billion boost expected from the Wall Street bonuses.
Yeah, you just read that right. In 2013, by giving huge bonuses to those on Wall Street instead of low-wage workers, we actively prevented the creation of about $22 billion in additional national wealth. In 2014, we did the same thing, but to an even larger degree, preventing about $23 billion in additional national wealth that would have otherwise been created, had those billions in bonuses been distributed to low-income earners instead.
Year after year, we prevent new wealth creation. Why is this the case? What causes such a big difference in wealth creation, such that money at the bottom is over three times more effective at driving economic growth than money at the top?
Well, economists call it the “multiplier effect” whose origins are in what’s called the “marginal propensity to consume.” It describes how those with little money spend it quickly and those with lots of money don’t.
Fast Money vs. Slow Money
Simply put, monetary exchanges have a frequency rate — a “velocity” — and this velocity is far higher at the bottom than at the top. When you have a lot of money, each individual dollar for the most part just kind of sits around. Sure, it may be put to use eventually, but these dollars are more like gold coins inside Scrooge McDuck’s bank vault. Occasionally they get swam in, but they’re really just there to be counted and look shiny. Additionally, they can even get sent overseas, to sit around in vaults elsewhere.
Looking at the latest money velocity charts and comparing today’s numbers to the historical record, is all one need do to see what happens to the overall rate of market exchanges when we start letting the top accumulate more and more of the total money supply.
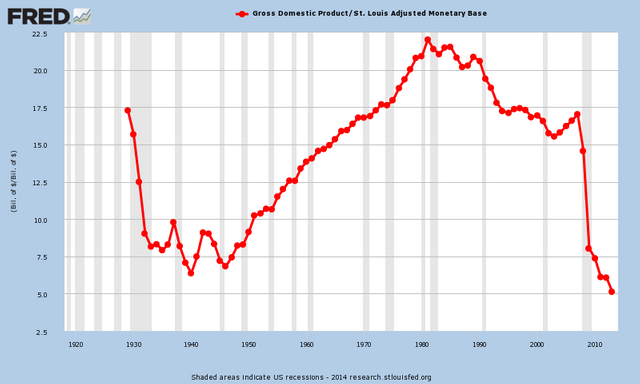
We are exchanging the dollars in our money supply more slowly than even during the Great Depression. The result has been an economy growing more and more tilted everyday, such that even Disney itself, a company built on middle class consumption, is actively leaving it behind in an accelerating sprint towards that shrinking population with money to spend in greater and greater amounts.
Meanwhile, that shrinking amount of money that’s still accessible in hands at the bottom? It’s changing hand after hand, and quickly. That dollar is no coin in a bank vault. It helps buy a gallon of milk, which pays a cashier, which helps buy a haircut, which pays a hair stylist, which helps buy a ticket to a movie, which pays a concession stand worker, which helps buy a dinner for two, and on and on it goes, like a fiery hot lava potato.
Food stamps are perhaps the best example of how quickly money gets spent at the bottom. When you have so little income that you need SNAP to eat, you’re spending every dollar of it. There’s no not spending it, because it has to be spent in order to stay alive. The result? For every dollar spent on food stamps, GDP grows almost $2.
The mechanism of how this works is effectively illustrated in a parable Tim Ellis shared on his blog that I recommend reading to further illustrate how money at the bottom does not stand still. Such money instead facilitates exchanges within the economy, which is the entire point of it all. That’s what an economy is. It’s all the exchanges that take place between the people who comprise it. When these exchanges aren’t taking place, there is no economy. But it’s also not only about the rate of exchange.
Section 2: Subtraction and Addition
It’s not just that someone with little money has enough money to spend that expands an economy. The most effectual part is that a dollar is also removed from the hand overflowing with dollars. Who knew Robin Hood oversaw such an effective economic stimulus program? But that’s how it works and also in a way that stabilizes the entire economy according to a new model built by Ricardo Reis and Alistair McKay of Columbia University and Boston University.
According to Reis and McKay, there is no better way of creating a more stable economy than to expand tax-and-transfer programs that specifically reduce inequality; like food stamps, and social insurance. A healthy economy is not one of extreme inequality, but one where everyone has enough money to spend into it, to the point they can start saving what they don’t need to spend.
When the only ones capable of making exchanges are a small percentage of the population, the entire economy suffers because the many are excluded for the benefit of the few, but this benefit too is an illusion. There is no real benefit. Pretending otherwise is like thinking that cutting off the blood in your body to everything except the brain is good for your health. It’s not. It’s good for gangrene.
OECD Findings
In a December 2014 report titled, “Trends in Income Inequality and its Impact on Economic Growth”, the OECD found that inequality slows economic growth.
“Rising inequality is estimated to have knocked more than 10 percentage points off growth in Mexico and New Zealand over the past two decades up to the Great Recession. In Italy, the United Kingdom and the United States, the cumulative growth rate would have been six to nine percentage points higher had income disparities not widened, but also in Sweden, Finland and Norway, although from low levels. On the other hand, greater equality helped increase GDP per capita in Spain, France and Ireland prior to the crisis.
One sentence from the report stands out in particular, as something absolutely vital to focus on to achieve strong economic growth.
The impact of inequality on growth stems from the gap between the bottom 40 percent with the rest of society, not just the poorest 10 percent. Anti-poverty programs will not be enough, says the OECD.
It is not enough to tax and transfer only from the top to the bottom.
Transfer recipients must include at least about half of the entire population. The incomes of the middle class must be increased alongside those living under or near the poverty line, and all of this entirely at the expense of the top. By not doing this, we all lose, even the rich.
Between 1990 and today, US GDP grew from $6 trillion to what is now $19.5 trillion. The OECD is saying that had we not allowed our inequality to grow alongside it, our GDP would have grown an extra trillion dollars. And had we reduced our inequality, our GDP would now likely be somewhere closer to $25 trillion.
But we didn’t do that. We instead shoveled money hand over fist into the pockets of those with already overstuffed pockets, and to this day we continue to do so. However, this behavior is beginning to be questioned by even more growth experts than the OECD. The IMF is now asking them too.
IMF Findings
In June of 2015, the International Monetary Fund upped the ante with an even more damning report on the effects of income inequality on economic growth than the OECD.
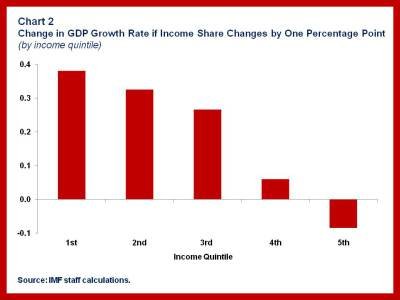
According to the IMF, increasing the share of the total pie of the top 20% by just 1%, (by say throwing bonuses at them) decreases economic growth by 0.08 points. It actually damages the economy. Overall wealth decreases. On the other hand, increasing the share of the bottom 20% by the same 1%, increases economic growth by 0.38 points, that makes it five times more effective and in the direction we actually want. Similar growth increases are seen in decreasing amounts for the middle three quintiles, with 0.33 points, 0.27 points, and 0.06 points respectively.
In other words, transferring money from the bottom to the top actually slows GDP. It erases national wealth. It shrinks the pie. Whereas doing the opposite, transferring money from the top to the bottom, is the equivalent of throwing Viagra at GDP. It quickly grows the pie. When the bottom 60% get a larger share, everyone greatly benefits, including the top 40%.
The OECD data points to redistributing from the top to the bottom 40%.
The IMF data points to redistributing from the top to the bottom 60%.
No data points to redistributing to the top from the bottom, which is — unfortunately for everyone — exactly what we’ve been doing for decades. Redistribution actively already exists, and it’s in the wrong direction for GDP growth.
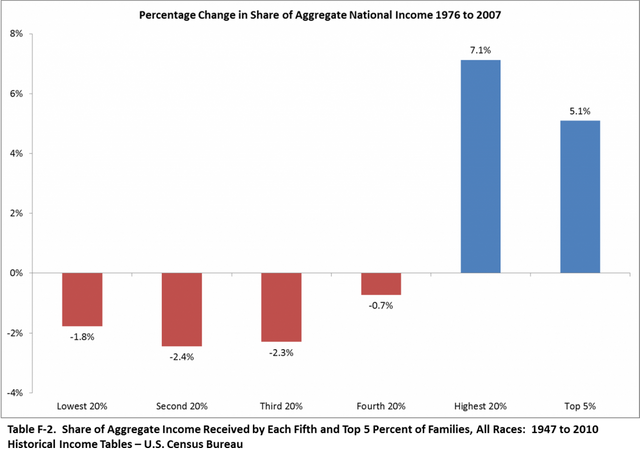
So this idea that we should ever let inequality increase because it grows the total pie is completely and utterly false. By letting inequality increase, the entire pie actually shrinks. If we want the pie to grow we need to shift some of that stagnant wealth of the top 20% over to the other quintiles, and the more we shift towards the bottom and middle, the faster the pie will grow for everyone.
This is a huge reason, if not the best reason, for everyone to support the idea of unconditional basic income: increased economic growth that benefits everyone. By reducing the rate of wealth accumulation of the top 20% in a way that better distributes that income to everyone else, we see the potential to build national wealth at historic new rates.
A BIG Economy
I’ve estimated before that the total additional cost required to give every adult citizen a basic income guarantee (BIG) of $1,000 per month and every citizen under eighteen $300 per month could be as low as $300 billion after the elimination of expenses no longer required with a basic income. This is less than 2% of GDP. (Note: the total cost of child poverty alone is about 6% of GDP)
If that revenue is removed from the vaults of the top 20% where it is sitting stagnant, and distributed to the bottom 60% (no need to alter the distribution for the 60–80% according to the OECD or IMF), that’s about a 1% increase in annual GDP growth with a unconditional basic income in place.
This may sound high, and admittedly quite wonkish, but I believe it’s also likely we’ll see second and third order effects along the lines of increased productivity, and wage increases through higher bargaining power, which would both result in potentially even larger increases to GDP growth with basic income than the IMF or OECD data points to. The stimulative effects of UBI have also been confirmed by a macroeconomic modeling analysis by the Roosevelt Institute that concluded a 12.56% increase in GDP after 8 years.
Our GDP growth rate right now is around 2%, and we’ve had around this growth rate for decades. With a basic income functioning as a means of reducing the share of the top 20%, and increasing the shares of the bottom 60% by giving everyone $1,000 per month, we should expect to see a new GDP growth rate of around 4% or more. We haven’t seen anywhere near this kind of growth since the 1980s, but perhaps we can see it again, if we start crafting policies that make sense using what we know, instead of continuing to rely on myth-driven policies that only serve to benefit — in an illusory way — an extremely small portion of our society.
This sounds too good to be true, right? Transferring cash from high income earners to low and middle income individuals and families can’t possibly result in as high of growth rates in the real world as on paper. What evidence is there for such claims? It must be impossible.
Well, let’s look at the observed economic effects of basic income and basic income-like policies, and also the observed evidence of anti-UBI, reverse Robin Hood policies, which further enrich the already rich.
Section 3: Evidence for Growth
Conditional and unconditional cash transfer programs have been spreading all over the world for decades now. At first it may have been surprising to observe large multiplier effects, but today it surprises no one. It’s expected. What we see with raises for the rich however, is not.
Effects of Cash Transfer Programs
Every dollar given to the bottom of the socioeconomic spectrum in cash transfer program after cash transfer program results in more than a dollar being added to the economy, sometimes even more than two. An unconditional cash transfer program in Lebanon of sufficient size to be considered a basic income illustrated this especially well with a result of $2.13 for every $1. The World Bank found similar multiplier effect results in Lesotho, Ghana, Ethiopia, and Zambia.
Combined with all the evidence we have for the entrepreneurial effects of unconditional cash transfers, it’s no surprise at all why these multiplier effects exist.
In Namibia, when given basic incomes, self-employment jumped 301%. In Liberia, when given basic incomes, 1/3 of recipients started their own businesses. In India, when given basic incomes, recipients were twice as likely to increase their productive work as those in control villages. In Kenya, when poor people were given cash unconditionally, 90% of them used it to start their own businesses or purchase livestock.
Remember again the evidence from food stamps in the US where every $1 adds almost $2, and know how it too increases entrepreneurial activity. The above multiplier effects are not just due to the data being from less-developed countries. When cash is given to those without enough cash to meet all their basic needs, economies grow. This is in stark contrast to what’s observed when the same dollar is handed as a bonus to a millionaire or billionaire.
Effects of Multi-Millionaire CEOs
Possibly the best example of taking from the poor to give to the rich is what we’ve seen with executive compensation trends for decades. Adjusted for inflation, wages and salaries have gone down, while CEO pay has gone up. The argument is that the better a CEO is paid, the more valuable they are to the company and thus warrant being paid over 300 times more than everyone else in the company. The problem is, the exact opposite is true.
Research from the U.’s David Eccles School of Business found that CEOs who receive higher incentive pay often lead their companies to decreased financial performance. The study found that the highest paid CEOs earn significantly lower stock returns for up to three years. Additionally, CEOs with an average compensation of more than $20 million were associated with an average yearly loss of $1.4 billion for their firms.
Paying CEOs more money results in companies that perform worse. Again, just as modeled by the IMF, overall wealth is erased by shifting more of it into the hands with most of it already. Companies that avoid raises for rank and file employees to instead give raises to chief executives perform worse, and contribute to negative growth in the same way as nations doing the same thing collectively.
Effects of Billionaires
The very presence of billionaires in a nation’s economy has now been looked at specifically in hopes of discovering how it affects the economic growth of the national economies of which they are part.
Leaving aside moral questions, do billionaires accelerate or slow down a country’s economic growth? Depending on the answer to these questions, even those generally inclined in the media and politics to boost the fortunes of billionaires might have to rethink their stance. After all, if it turns out that having more billionaires doesn’t favor GDP growth, the policy suggestion to reduce income concentration at the top moves from a moral argument to one about economic growth and prosperity.
These questions led to some very interesting research findings by Jan Svejnar and Sutirtha Bagchi after applying econometric techniques to data on billionaires published by Forbes.
We discovered that billionaire wealth that arises from being politically connected has a strongly negative effect on growth. In contrast, the effect of politically unconnected billionaire wealth on the overall economy is indistinguishable from zero. That means that billionaire cronies constrain economic growth, while billionaires who aren’t cronies on average don’t do so. Why are these findings important for the rest of us? They indicate that public policy toward income and wealth distribution needs to take into account the nature of wealth accumulation.
So not only does the presence of billionaires in an economy not result in stronger economies as trickle-down economics would suggest, but the type of billionaire actually matters. A billionaire who does not invest money into politics for economic gain has essentially zero effect on GDP growth.
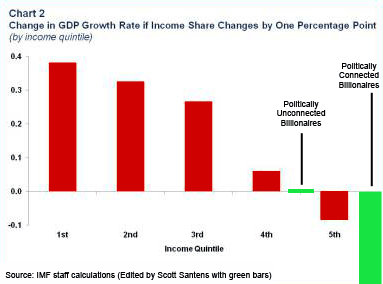
Looking again at the IMF chart to the left, this time with green bars I’ve added to reflect billionaires, the effect on growth of politically unconnected billionaires is located between the 4th and 5th quintiles, right at the 0.0 line. They add nothing to economic growth, nor do they slow it. The politically connected billionaires though — the Koch brothers as a prime example — they are off the chart with a bar so far into the negative they make the other billionaires look responsible for the damage their political machinations are wreaking.
Conclusion: Division
Our politics have become a twisted version of the principles we claim to hold dear, where everyone is to have a voice in this supposed democracy of ours. Instead, dollars have become speech, and where dollars are speech, the voices of the many are drowned out in a deluge of the best speech money can buy.
When 1% of the electorate has the majority of the voice, democracy does not exist. When 1% of the electorate owns the majority of the stocks and bonds, the economy is effectively privately owned. The phrase “going public” with each new IPO holds little actual meaning today. When 1% of the electorate is able to rig the game in their favor, they do, but as if that isn’t bad enough, a rigged game destroys the game itself.
By allowing our inequality to grow to the point it exists now, every single one of us is supporting something against our own best interests, poor and rich alike. To continue to allow our economy to fallaciously serve only the interests of a small fraction of the population, everyone will be worse off.
We need to recognize myths where they are perpetuated and the myth of trickle-down economics can not be allowed to stand any longer in the 21st century. To grow our economies we need to accept the policies that enable economies to flourish. Policies that reduce our inequality — policies like universal basic income designed to move stagnant money from the hands at the top not spending it into the hands of all those who will — are the policies we need.
No more trickle-down economics.
Without a pump to circulate money throughout our entire economy, systemic failure is inevitable.
A first of its kind data set by the Federal Reserve Bank of San Francisco published in December of 2017 reveals that wealth accumulates faster than economic growth can ever hope to keep up with. As summarized in the Washington Post:
With the exception of wartime, when instability rattles stock markets (or shuts them down completely) and bombs literally destroy housing wealth, the rate of return on wealth has been considerably higher than the growth rate of the major economies. Overall, if the average annual return on wealth since 1870 has been 6.28 percent, average annual economic growth works out to just 2.87 percent.
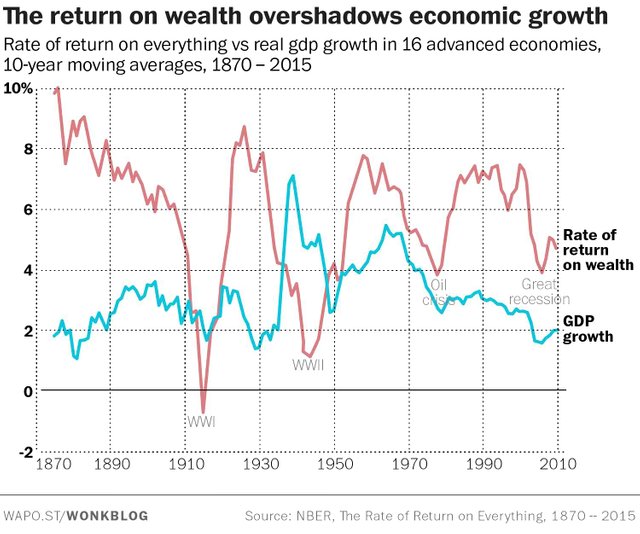
The ramifications of this data are unavoidable. Without sufficient redistribution, outside of World War III or violent revolutions, economies will inevitably fail if left to operate on market forces alone.
Essentially, the economy needs a heart, not more blood, because on its own, money has one net direction — up. It’s time for our economics to grow up too, in realization that all economies are built from the ground up, upon the shoulders of the many — not the few — who comprise them.
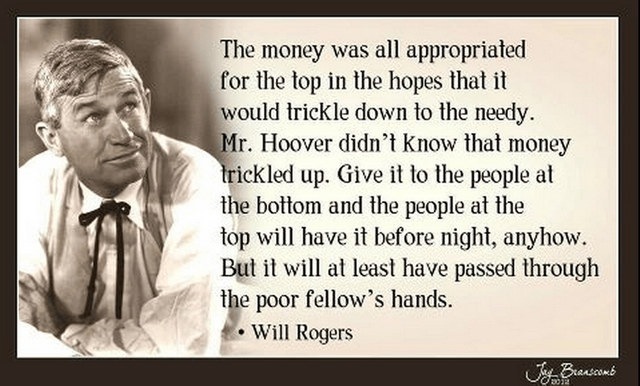
The fact that even the phrase “trickle down” as a description of government policy was born in the mind of a comedian, should serve as a sober reminder of how the joke has always been, and without needed changes will continue to remain, entirely on us.

I promoted your post first time ever :-) I totally agree let’s change the world!
Thanks! Let's do it!
The best case for UBI I've read so far. Thanks
You got a 31.51% upvote from @steembloggers courtesy of @scottsantens!
Down with Arthur Laffer.
Hi! I am a robot. I just upvoted you! I found similar content that readers might be interested in:
https://medium.com/basic-income/trickle-down-economics-must-die-long-live-grow-up-economics-5b8334a0db76
This post has received a 6.21 % upvote from @upmyvote thanks to: @scottsantens. Send at least 1 SBD to @upmyvote with a post link in the memo field to promote a post! Sorry, we can't upvote comments.
We need to revise our economic thinking to give full value to our natural resources. This revised economics will stabilize both the theory and the practice of free-market capitalism. It will provide business and public policy with a powerful new tool for economic development, profitability, and the promotion of the public good.
Humans aren't as good as we should be in our capacity to empathize with feelings and thoughts of others, be they humans or other animals on Earth. So maybe part of our formal education should be training in empathy. Imagine how different the world would be if, in fact, that were 'reading, writing, arithmetic, empathy.'
Testify!
This post has received a 4.86 % upvote, thanks to: @scottsantens.