The Best Bitcoin Cash chart you will ever see.

After consulting the Crypto Gods - I have returned with a message for all who wish to hear:
BITCOIN CASH WILL RISE AGAIN!!
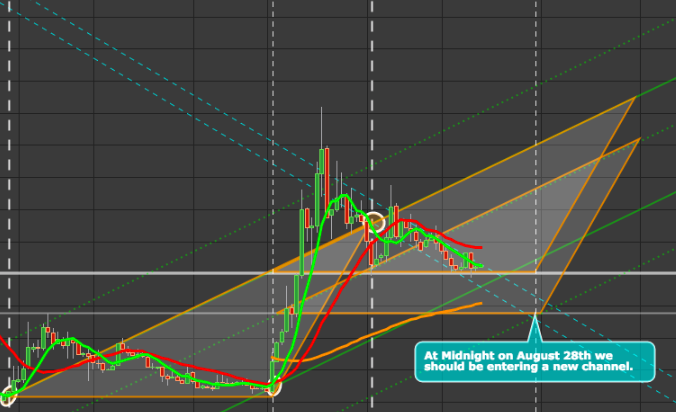
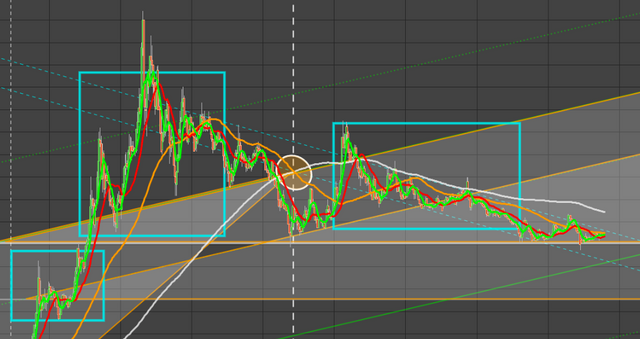
The blue channel is the current downtrend we are in, but the orange triangle captures the more prominent shift in momentum already built inside the chart. As you can see once you overlay these intersections into the areas of consolidation built inside the 21m chart things look a bit differently...

Notice we have more areas of coverage in the key places in the chart.
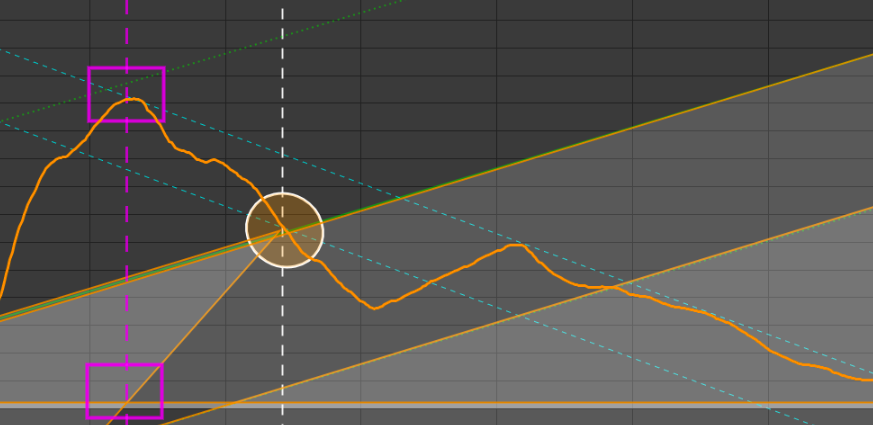
Also notice how the the apex of the triangle in the purple box project perfectly into the top of the Orange curve, which signals the momentum shift into the downtrend that follows.
![Screen Shot 2017-08-25 at 7.35.09 PM.png]
( )
)
#1 Commandment of Crypto: Thout shalt profit and prosper.
Please Resteem if you find this information valuable! Best of luck in the markets!!
Peace & Love -
BK
thanks king of crypto
AWESOME! I look forward to learning how to build these charts like you.
All the BEST!
Thank you! Checkout my playlist on YouTube: How To Chart Like A Boss
Great stuff.
Hi thanks for the update. When do you think we are likely to see this rise?
Thanks for your chart :)