February 1st, 2019 Bitcoin Ichimoku Summary
January ended and brought Bitcoin into a 6th straight month of lower closes and the 7th consecutive month where no monthly high met or exceeded the prior month. Could February provide some reprieve?
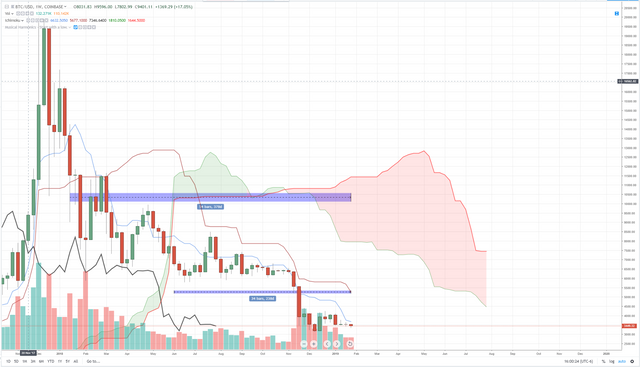
Bitcoin Weekly Ichimoku Chart
The prior two weeks for Bitcoin have shown some extreme constriction and consolidation. If we look at the open and close of two weeks ago, we see that it opened at 3481.01 and closed at 3536.19. And just last week Bitcoin traded in a similarly tight range with an open at 3537.56 and a close at 3425.00. The current weekly candlestick is definitely more bearish than the prior two weeks, but the price action has been noticeably bullish over the past few days. There is a fairly decent wick on the current candlestick showing buyers are involved. There remain a few more days for this weekly candlestick, but it appears we are going to surpass last weeks trading volume and we could very well surpass the volume from two weeks ago. Price continues to trade below the cloud and below the Base Line. It has been 54 weeks (378 days) since Bitcoin last traded above the Base Line and 34 weeks (238 days) since Bitcoin has traded above the cloud.
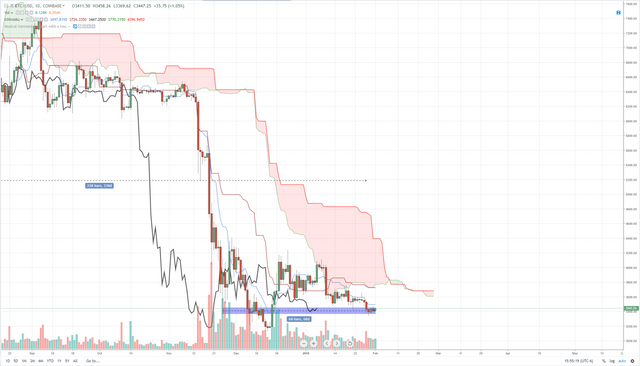
Bitcoin Daily Ichimoku Chart
(
Bitcoin’s daily chart is boring. That’s about the only way I could describe it. Given the proximity of price to the Cloud and the Base Line, it’s odd that we haven’t seen any considerably strong selling to continue the trend lower. That type of move would be very easy considering just a small whiff of air could push Bitcoin into a Low Volume Node and see price collapse swiftly into the 2600 value area. But there has been some volume and very strong buyers step in during the Friday trade – which also happens to be the first day of February. Given the 180-day Gann cycle that has completed, there is a strong probability of a move higher for the entire cryptocurrency market. For Bitcoin’s chart on the daily Ichimoku setup, we’re not too far away from price being very close to a rapidly thinning cloud, the earliest time being the 7th of February. We should expect to see this cloud continue to constrict and flatten out as we have been in the same trading range very since November 25th, 2018 – 68 days of consolidation after the biggest percentage loss since 2014.
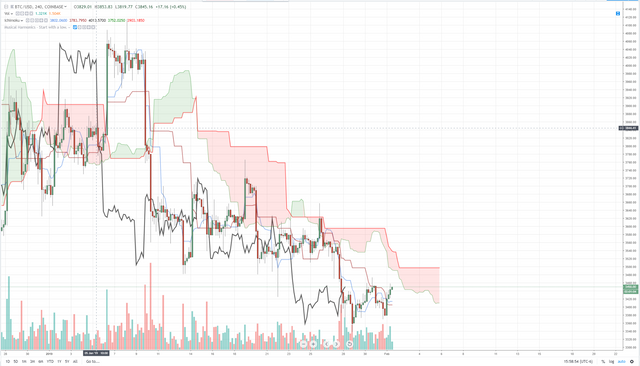
Bitcoin 4-hour Ichimoku Chart
My favorite time frame – the lovely 4-hour chart. Ever since Midnight, Bitcoin has been trading higher and on rising volume. It has moved past the Conversion Line and the Base Line and is inching closer to the bottom of the Cloud – which is not as thick as it could be. The Lagging Span has also moved above the candlesticks. It will be very interesting to watch what Bitcoin will do on this timeframe as we move ever closer to the bottom of the Cloud. If we get a condition where price and the Lagging Span both are able to move above the cloud, that would give us our first bullish breakout signal since the false breakout back on January 6th. Expect some monster moves if we do close above the cloud over the weekend. ![020119btcd.PNG]


Congratulations @captainquenta! You have completed the following achievement on the Steem blockchain and have been rewarded with new badge(s) :
Click here to view your Board
If you no longer want to receive notifications, reply to this comment with the word
STOPTo support your work, I also upvoted your post!
El mes de febrero se vislumbra como el mes de arranque hacia la recuperaciòn de precio de esta moneda. Tomemos las siguientes consideraciones: noviembre y diciembre son meses donde predomina la desinversiòn, aumenta el consumo y proliferan los gastos y enero se considera como el mes de la estabilidad y la recuperaciòn de recursos para invertir; asì que febrero està llamado a constituirse en el mes de arranque y despegue para el mercado criptogràfico.