Bitcoin (BTC): Price Action Review (Thu, 19-Apr-2018)
For education.
Price (holding range)
Following on from yesterday's review (here), the BTC price has held the $8,000 level and has formed a flag(ish) pattern.
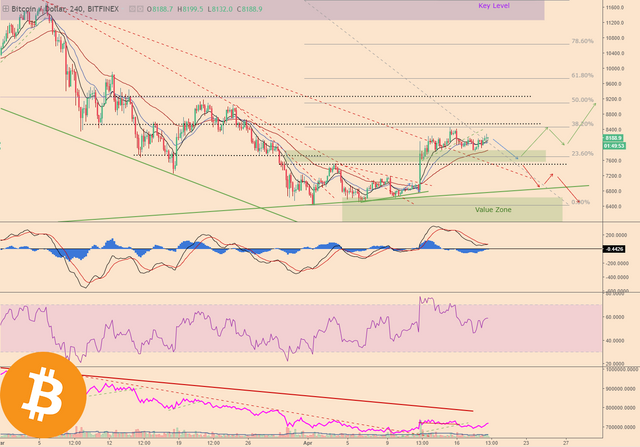
I was expecting BTC to have retraced back to $7,600 by now, but is it showing some resilience. The current price pattern could still be described as a mini-head and shoulders however, if the price pulls-back from here and breaks the neckline (@~$7,600).
Indicator Check (mild divergence)
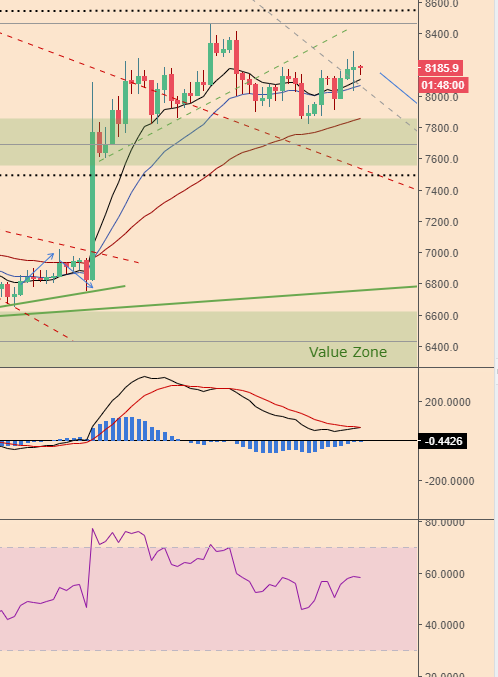
The price action for the past few days has been sideways, whilst the MACD (black, red, blue) and RSI (purple) have been drifting downwards, indicating weakening of the asset, however, the strength of this divergence signal is marginal.
Volume (flat)
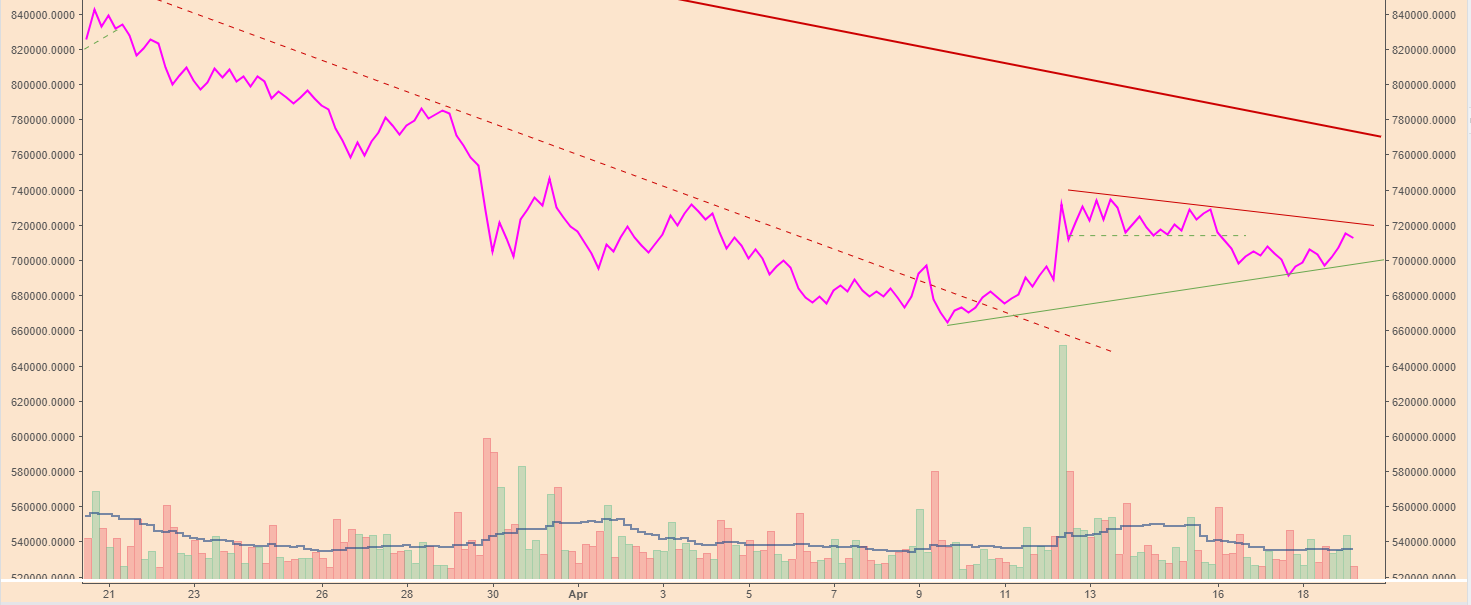
The trading volume (bitfinex) is flat and the On-Balance-Volume indicator suggest buyers and sellers are relatively equal in strength, indicating indecision in the market.
Trading strategy (waiting for further pullback)
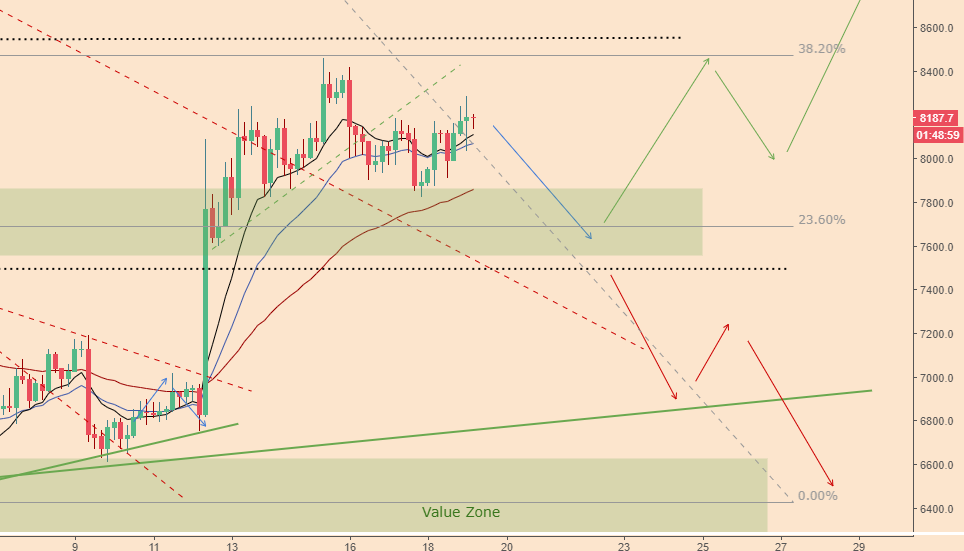
Before considering a long position, we're waiting for a more convincing pullback to flush out more sellers. Completion of the head and shoulders pattern or a retrace to the $7,600 level is the setup we're keeping an eye on.
The alternative scenario is BTC sets off northwards from here (making a higher high above $8,500) at which point we'll have to reassess the potential trade setup.
Until tomorrow.
Bobby
(Trader)