Bitcoin (BTC): Price Action Review (Tue, 17-Apr-2018)
For education only.
Price (pulling back)
Following on from yesterday's price review (here), the BTC price has pulled back to about the $8,000 level.
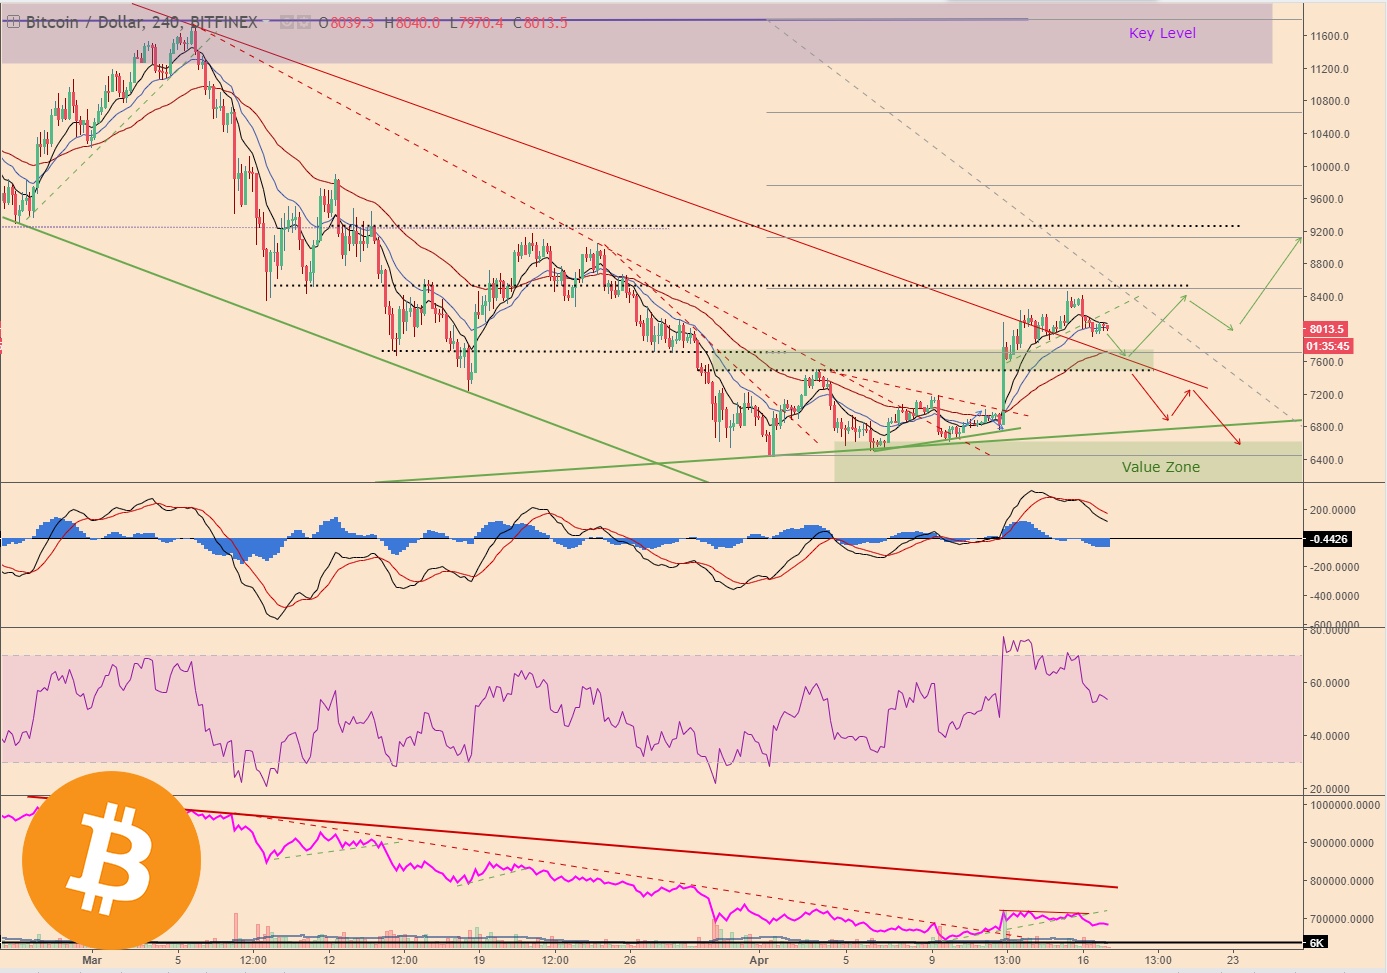
Apologies for the busy chart.
This pullback is expected as the market needed to relax after its outsized move last week. In fact I'd like to see a further retracement back to about the $7,600 level, before resuming the uptrend and making another attempt on the $8,500 resistance level.
Indicator Check (divergence)
Using the MACD (black, red and blue) and RSI (purple) indicators to check for convergence/divergence (agreement) with the price action. We can some divergence (disagreement) with the price just before the small pullback:
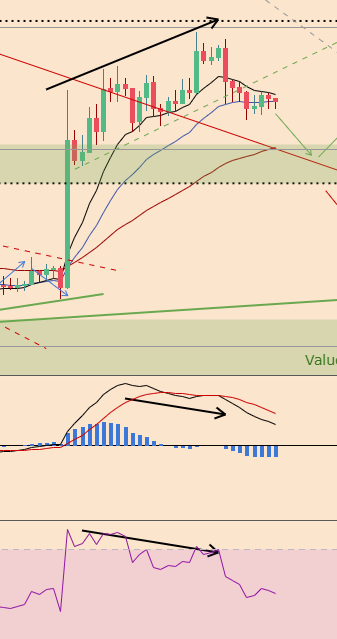
Divergence usually suggest a discontinuation in the move and in this case supports our desired set-up of a further pullback.
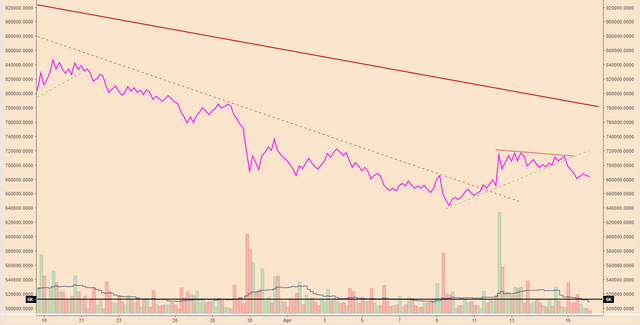
Volume (steady, some distribution)
Not much to say on the volume front, average is holding steady and the On-Balance-Volume Indicator (pink line) is indicating some distribution (selling), mirroring the price chart.
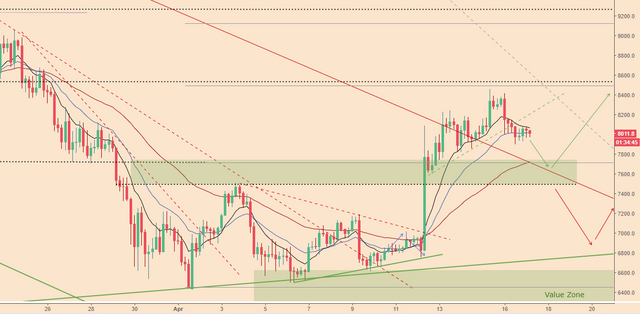
Trading strategy (pullback, consolidation, long)
I'm still looking for a further pullback to about the $7,600 where the broken descending trendline and moving averages might offer support to the price which would be more relaxed and potentially primed for another leg up.
However, before going long we're looking for some price structure to form, or an obvious reversal signal (small trigger candle, interim double bottom etc.) immediately following the retracement.
Until tomorrow,
Bobby
(trader)
Thanks for sharing.
You're welcome.