Bitcoin (BTC): Price Action (Sat, 21-Apr-2018)
For education.
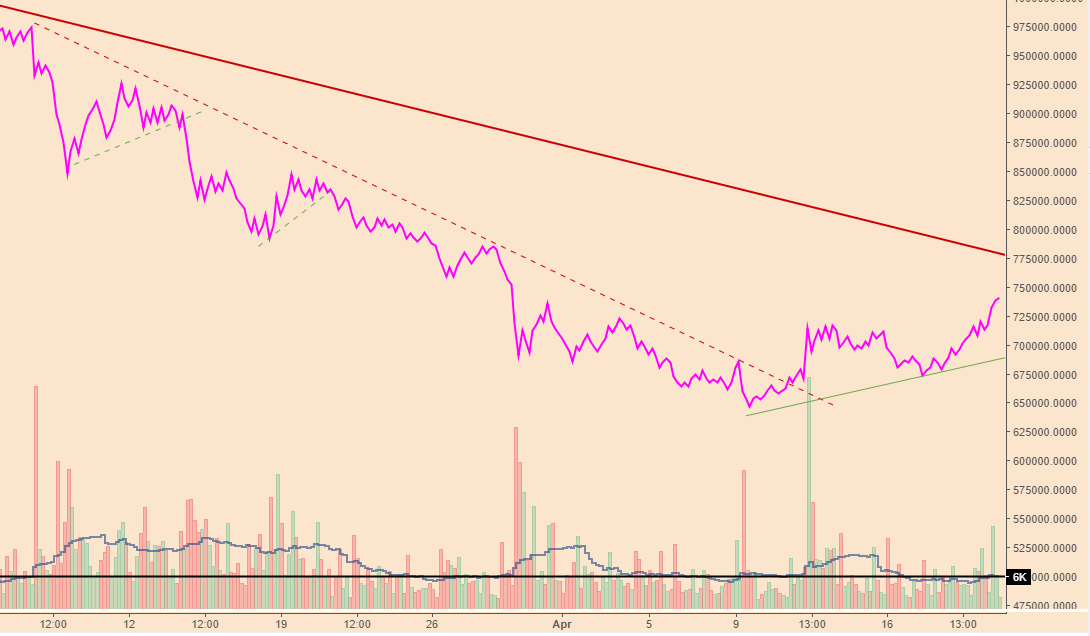
Price (breakout)
Following on from yesterday's review (here), the BTC price formed an area of consolidation between $8,450 and $8,550, which broke out to the upside in a classic breakout formation.
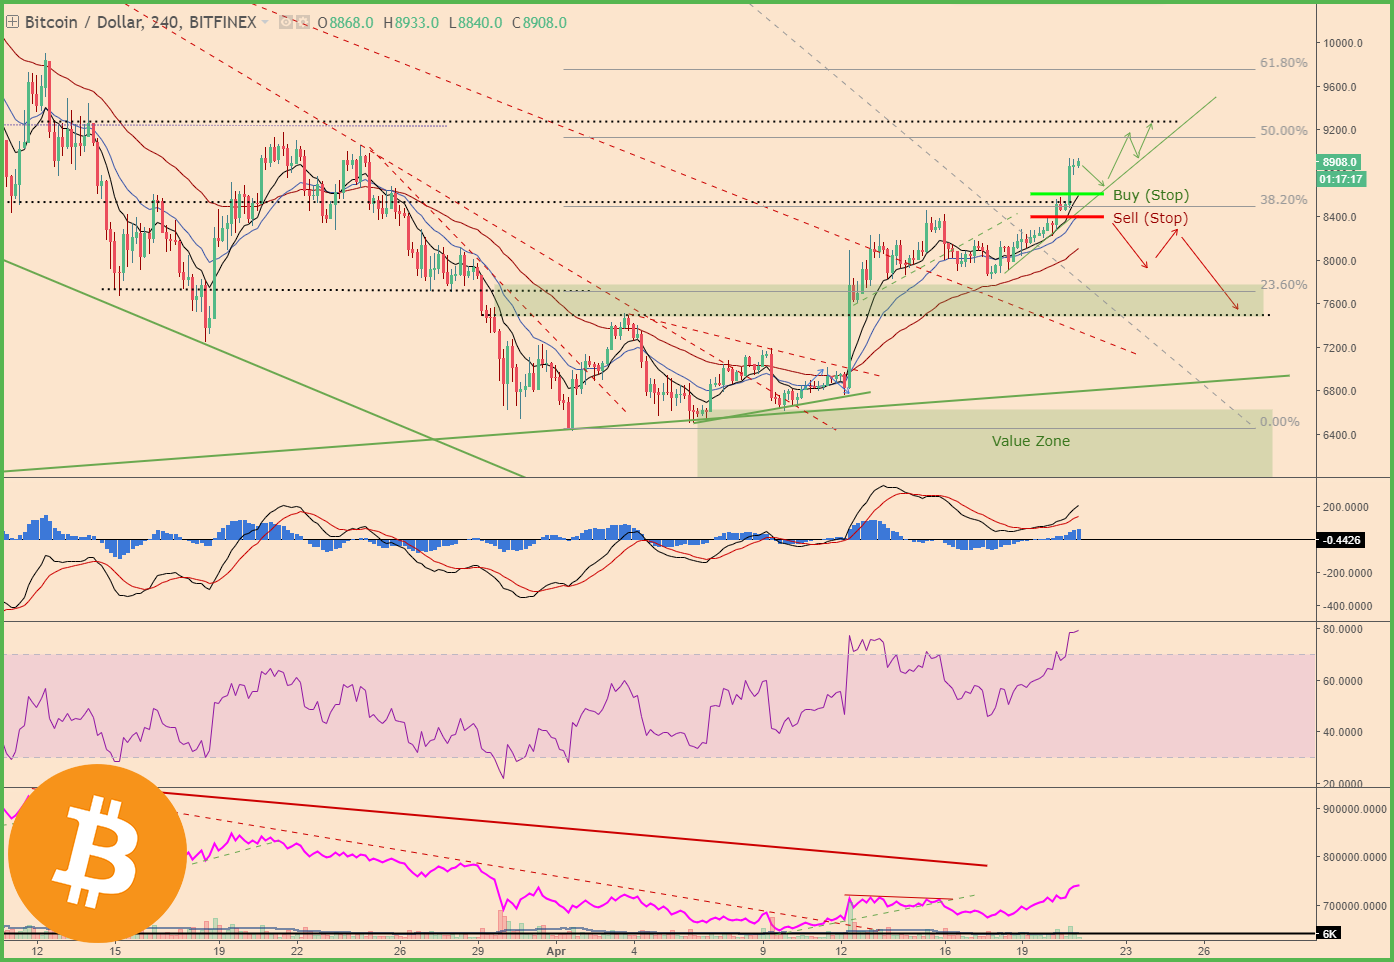
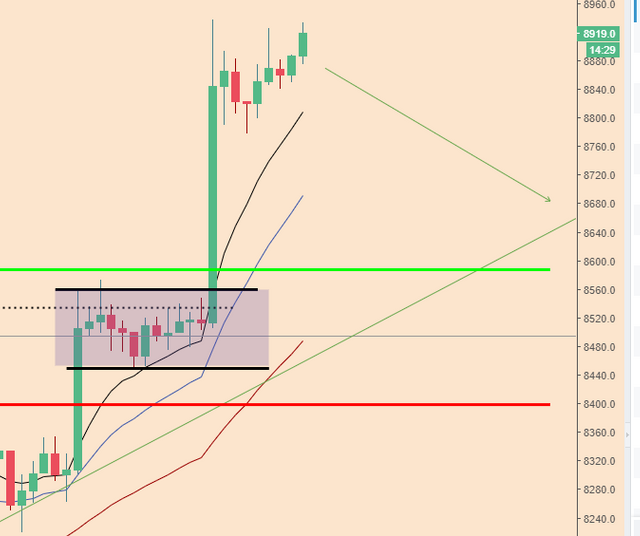
BTC is currently trading at approximately the $9,000 level and could easily challenge the overhead resistance at $9,500 on the back of momentum.
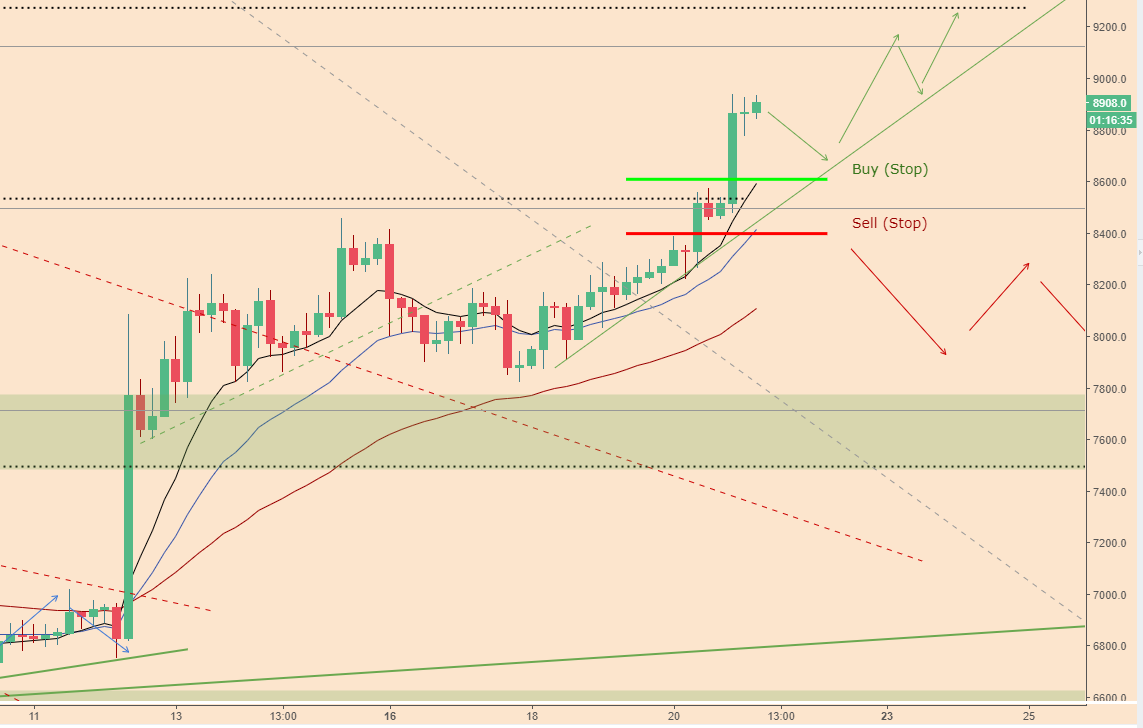
However, for this rally to be sustainable, I'm looking for the price to settle into a series of higher highs and higher lows, which could drive the price all the way up to $11, 000.
Indicator Check (convergence)
The MACD (black, red, blue) and RSI (purple), although overbought, is not signalling a false move through divergence with the price action.
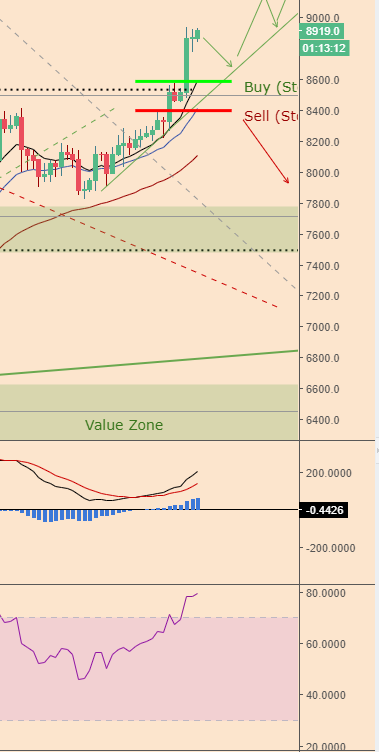
Volume (modest increase)
The breakout in the price was accompanied by only a modest increase in trading volume (bitfinex) but the On-balance-Volume (OBV) had a strong move, indicating a significant bias to the buyer side.
Trading Strategy ('trendflow')
If you missed the breakout move (which I did), where you could have gone long @$8,600, with a sell stop under $8,400 (which could now be moved to breakeven), the next long opportunity is a trend following strategy.
Signals:
- pull back to a level of support/trendline (~$8,700)
- consolidation / closed small reversal candle between MA(10) and MA(20)
- convergence on RSI and MACD
- small dip in volume
Entry just above the reversal candle
Stop just below the reversal candle
Target 1: $9,300
Target 2: $9,500
Target 3: $9,900
Target 4: $11,000
Let's see if we get the entry signal. If you're already long, you could use this to scale your position (of course this is hypothetical and not investment advice).
Until tomorrow,
Bobby
(trader)