Bitcoin (BTC): Price Analysis (Mon, 23-Apr-2018)
For education.
Price (pausing, trend weakening)
Following on from yesterday's review (here), the BTC has paused its run up and consolidated between $8,600 and $9,000 stopping shy of the 50% fib retracement level.
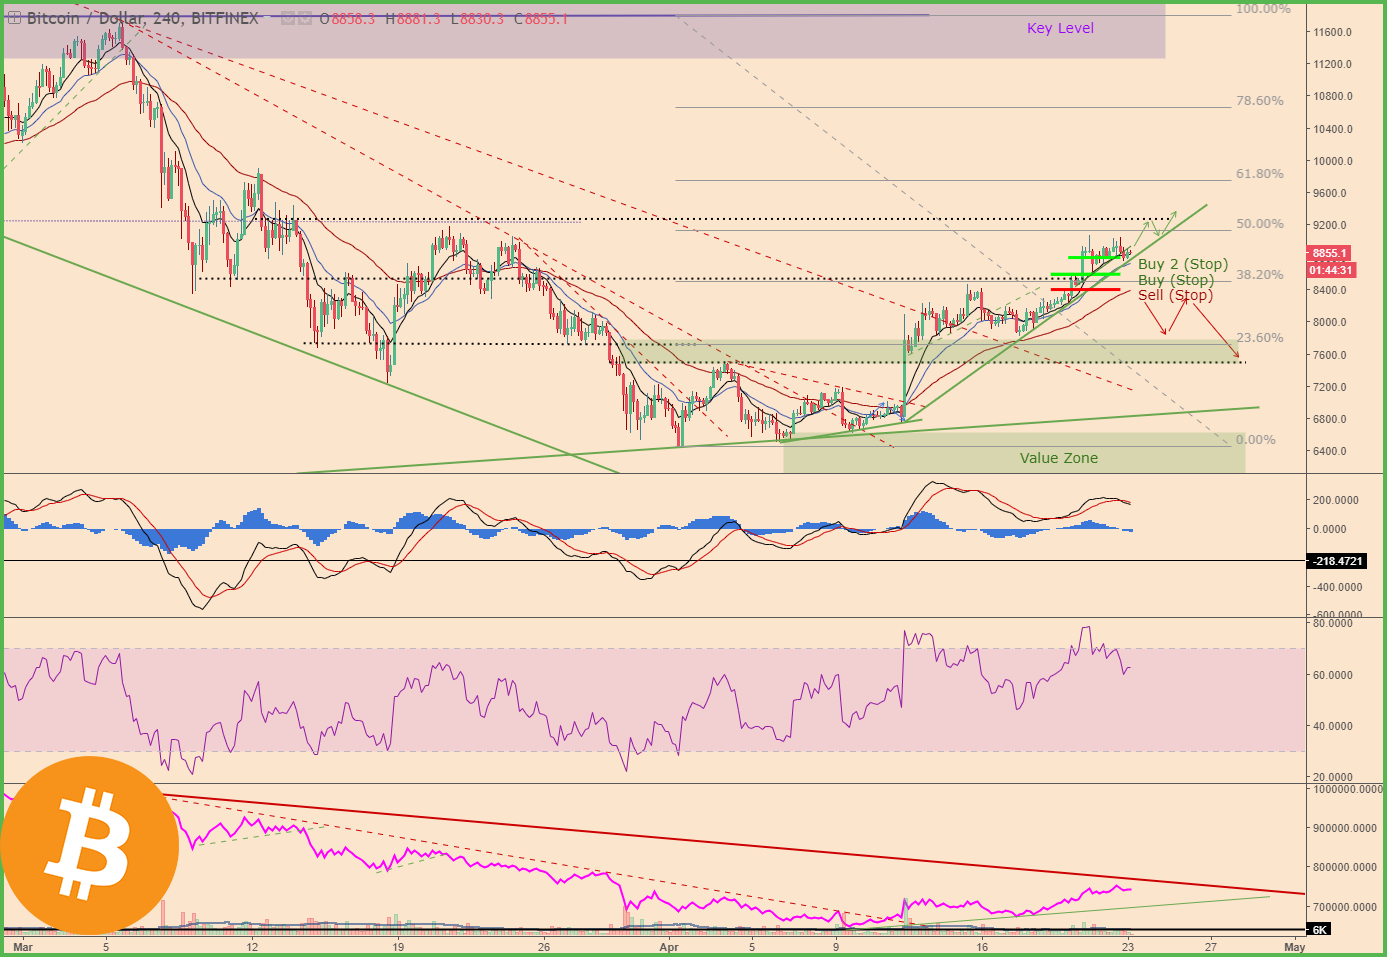
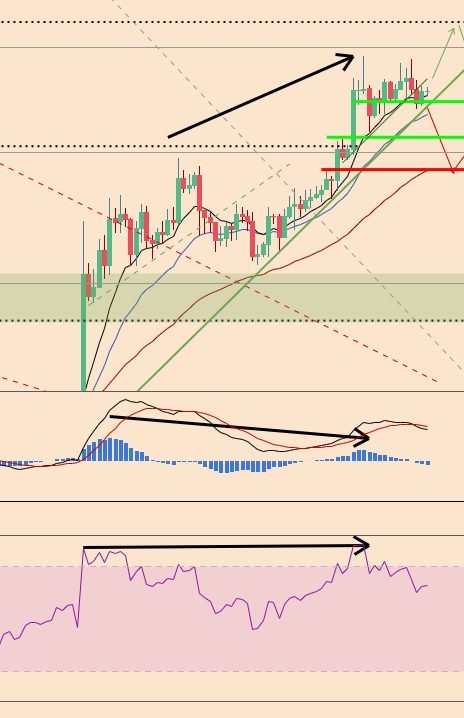
The price is exhibiting some weakness, failing to make a higher high on the second attempt at the $9,000 level. This is a potential red flag that there might be a pullback on the cards.
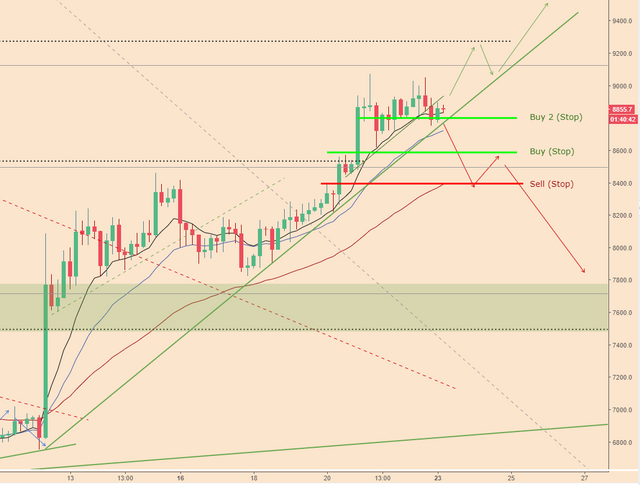
Both long trades are still in profit and active, but unless the price responds to the ascending trendline support (green) it may be an exit signal to preserve capital and take a small profit on the first trade.
Indicator Check (MACD divergence)
There is possible divergence on the MACD which is the second red flag that the trend is weakening.
Volume (low)
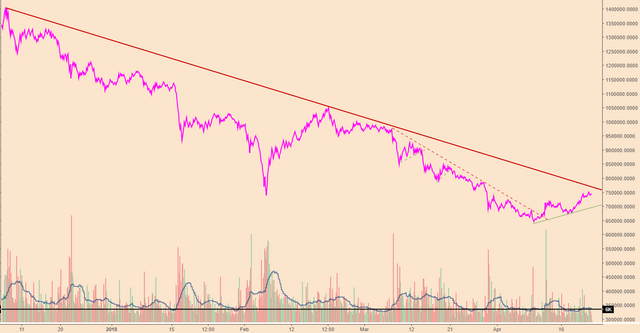
The trading volume is low (bifinex), but seems to be the recent norm. The On-Balance-Volume (OBV) indicator (pink) is approaching the downtrend line and although this is a derived indicator and this line may be a phantom, the indicator has responded to it previously, meaning sellers may become dominant when it reaches the line (a possible third red flag).
Trading Strategy (swift recovery or early trade exit)
If we're going to stay in these trades, the ascending trendline support must hold and the price must have another attempt at $9,000. If it fails for a third time, the writing will be on the wall and it'll be time to exit and look for another trade opportunity. Similarly if the price breaks below the rising trendline support.
However, it's worth just watching for now, as the apparent weakening trend (the red flags) may just be a symptom of the price encountering resistance at the $9,000 level (a psychological level?).
Until tomorrow,
Bobby
(Trader)