Bitcoin Price Analysis: Bitcoin Rally Shows Strength.

Today, bitcoin reached a new all time high as it rose by $500 in just a few short hours. At the time of this article, bitcoin is sitting in the $5300s as it looks ready, once again, to spring for a new all time high:

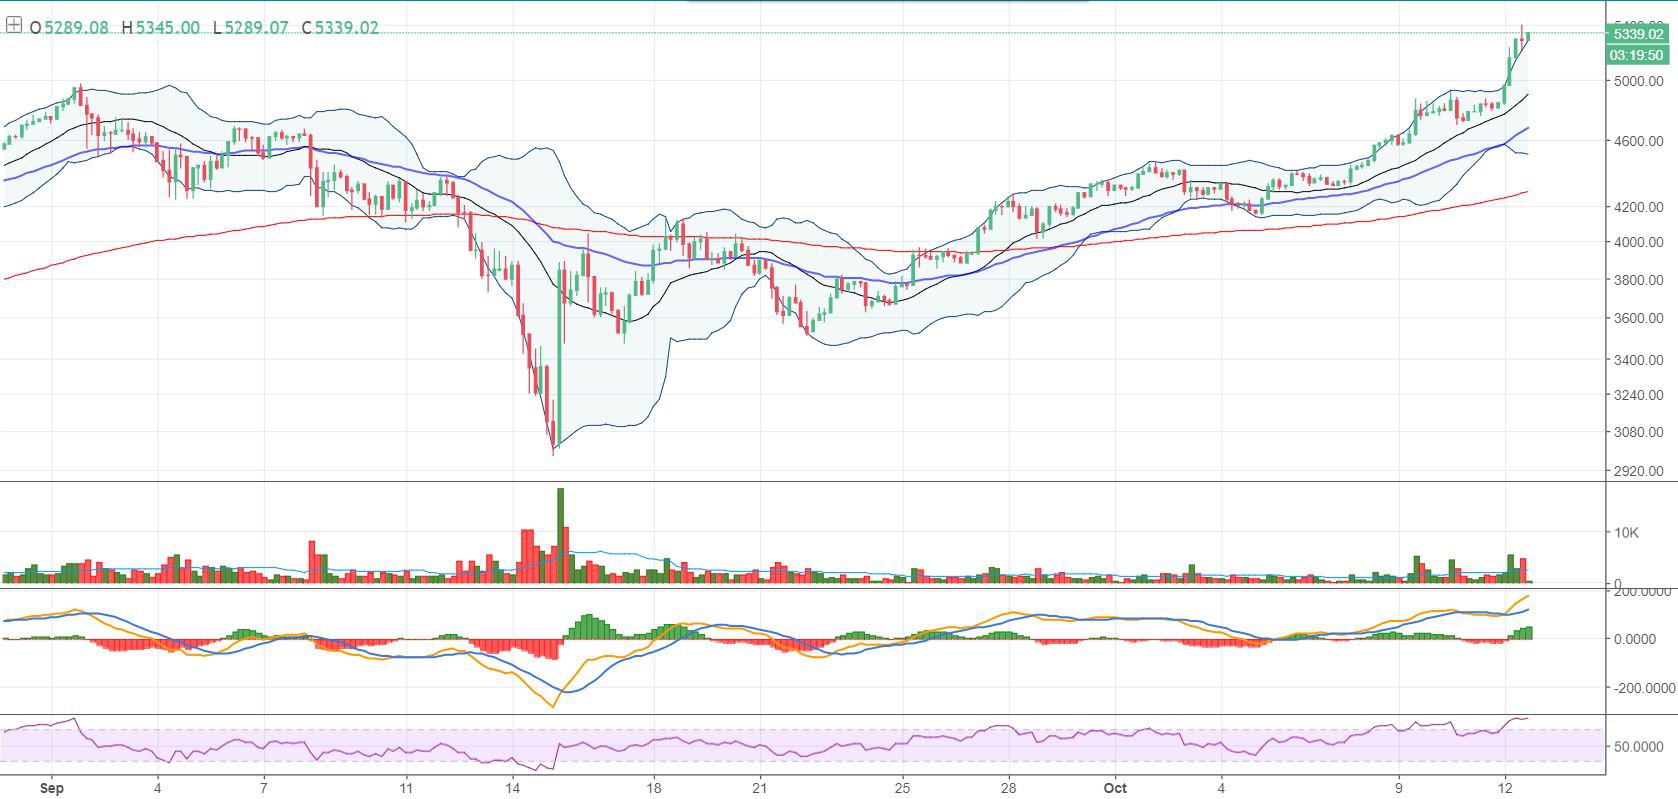
Figure 1: BTC-USD, 4-Hour Candles, GDAX, Macro Trend
On a macro level, BTC is showing signs of upward strength as the RSI and MACD are showing bullish strength. There are no clear signs of bearish divergence yet and the market is starting to pick up in volume as the price climbs, thus indicating that a healthy bullish continuation is likely. Looking at the 50 and 200 EMAs, we can see the slope is pointing upward and the market is trending well above both EMAs, showing us that the market is pushing upward in a sustainable manner.
On a micro level, there are slight signs of bullish exhaustion that may indicate the need to either consolidate sideways or pull back slightly before continuing upward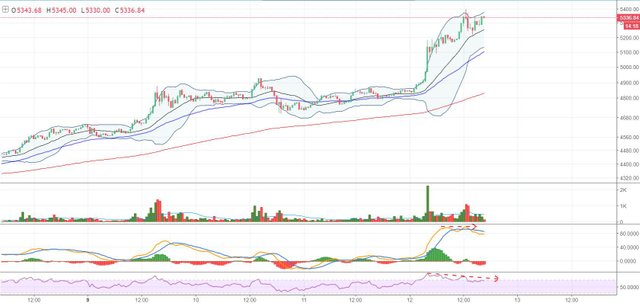
Figure 2: BTC-USD, 30-Minute Candles, GDAX, Micro Trend
The MACD and RSI are showing clear signs of bearish divergence on the smaller timescales (shown via the red arrows on the indicators). Also, the current growth is decreasing in volume which usually indicates a lack of buyer interest at the current price levels as the trend continues upward. It’s important to note that the trend can remain healthy on a macro scale, while simultaneously remaining divergent on a smaller timescale. The divergence doesn’t imply a macro reversal — it simply means the current trend is lacking momentum to continue upward in the immediate future and likely needs to cool off before continuing any further.
Hi! I am a robot. I just upvoted you! I found similar content that readers might be interested in:
https://bitcoinmagazine.com/articles/bitcoin-price-analysis-bitcoin-rally-shows-strength-continued-growth/