Bitcoin - Unlocking The Mystery Of The Intra-Day Moves (Before It Happens!)
In my days of a licensed professional trader, it was my responsibility to develop and maintain the many different trading algorithms. During the Dot Com era, there was a tremendous need to build something dynamic and powerful to keep up with the big price moves.
Those were the days where fundamental analysis meant nothing as they couldn't be applied to almost all Dot Com stocks. If you only relied upon it you would have never have taken part in those stocks that went straight up many hundreds of dollars a day, much like Bitcoin.
The Dot Com era was very similar to today's pricing of Bitcoin and other crypto's. Therefore, getting ahead of the curve is the only way to get a handle on how to get a piece of those unbelievable price movements.
Although, it's easy to draw support and resistance lines from previous price points, but what if there was something you can use when something is going straight up without pull backs. Is there a way to know what those areas of resistance and support will be ahead of time...
What I'm going to share with you is exactly the same methodology I have relied upon to get an edge. I want you to see what is possible. This is a very powerful tool, and I want you to think about how it works and then build something better, once you realize what is obtainable, if you experiment and try new things! You won't regret reading the entire article. Don't worry if you don't absorb all of this the first time, I will be going over it again with examples for a weeks.
So let's begin!!!
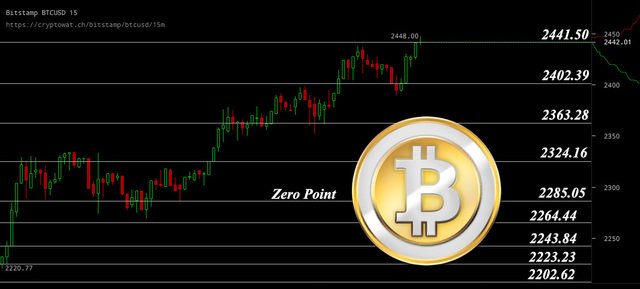
Here is a chart of Bitcoin, as you can see there are several horizontal lines across various price levels, let explain what each one does. To some of you, they may seem to be similar to pivot lines, but as you will soon see, they are very different.
We will start with the first line that I call 'Zero Point,' which is formulated with a mathematical equation that pinpoints its own underlying critical mass. On the chart above you can see it on the 2754.69 price line. This is what you can consider as its fair value for the next trading day. Being that Bitcoin trades 24hrs a day, as a reference for open and close pricing, we are using midnight EST in these charts to develop the next day's trading areas.
The calculation for the Zero Point must be recalculated every day. However, at times it can be used for a day or two, depending on the price movements. Anything above the Zero Point line indicates strength and thus anything below will indicate weakness.
Each line above or below the Zero Point can be considered a 'Sigma.' What is a Sigma? To give a few perspectives, its the standard deviation of the distribution. You can also think of it as how spread out something can be considered normal and how far parts of it extend out even further and yet how far those rare points are extended even further, each of those spaces is a sigma.
For example: If you drop some change on the floor, most of them are really close to your feet and some a bit further and yet some roll far away and every once in a while one rolls completely across the room. Each of those areas is a Sigma and now you can visualize how rare that one coin that rolls across the entire room really is.
So let us explain a bit further what those upper and lower lines are doing. Both of them do something independent and they both have the unique property of seemingly being fractal. (more on Fractal in just a bit)
The Upper Lines :
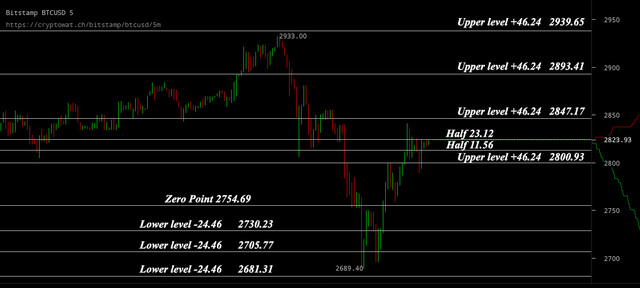
The Upper lines are constructed from a special algorithm that yields a number, in our example here the number is 46.24. With that number you can plot lines 46.24 above the Zero Point line and can repeat it as many times as needed, as indicated on the chart. You can see on the chart above how the price reacts to those lines.
When the Zero Point line is calculated correctly, the upper line can be repeated, doubled or cut in half, as many times as needed, to pinpoint larger or smaller price movements. This is where it appears to be fractal. It's pretty cool to watch it in action, as its pretty darn accurate. Please note, being that they're many different exchanges for Bitcoin, you may see a few bucks variance, but for nearly 3000 price, it won't mater much.
The Lower Line:
The Lower lines operate similarly to that of the Upper lines, in our example here the line number is 24.46. This number can also be used repeatedly and also doubled or cut in half as many times as needed to pinpoint the price movement for the time period you are seeking.
Width of the Upper and Lower Lines:
As you can see, the Upper line (46.24) number is nearly twice as large as the lower (24.46) this will show you which side of the bull bear side is dominating. Not surprisingly for Bitcoin, that it is extremely bullish. However, as the opposite grows, the trend will turn as well. This is another great built in indicator. Also, you may have guessed by now that if they are equal, you can expect the price movement to run sideways for quite a while.
Fractal
I told you I would get back to what fractal was! For a more detailed understanding of this concept, please google Fractal or Mandlebrot. However to keep things simple, a fractal is a design that as you keep zooming in on you see the same design again and again. It is my belief, and no accident that you can takes these Upper & Lower figures and double or split them continuously and still see support and resistance lines take shape. To me this is the single best confirmation of its overall accuracy and dependability.
Look at the chart below in the white circle and the A C B indicators:
The first Upper line at 2847.17 (+46.24) was cut in half to (23.12) at line A at 2824.17, then again to (11.56) at line B at 2812.49, and yet again at (5.78) at line C at 2818.27. See how the support and resistance lines react to the price movement on the one minute chart. These are not some arbitrary lines drawn from a previous price point, they are done way before it happens. Now you must agree that is pretty amazing stuff!!

Skeptical? No need to be, I'm not selling anything. In fact, I will be offering these line figures a few times a week, for as long as you find it useful. We can also expand into stocks if we get enough people who enjoy it. You can draw your own horizontal lines and watch them and see if this is something that helps you increase your edge on trading or just timing your entry and exits. Just imagine visualizing the best time to get in or out of the day to raise cash for other purchases or trade a little with confidence. Use any time chart you wish whether the 15 minute charts, 5 minute or even a 1 minute chart. Just have fun with it!
I'm new here and would love to hear your feedback. Stay tuned for more deep insights on other topics like this as well as other interesting perspectives you probably never seen before...
If you found this article helpful, there's plenty more to come so please don't forget to UPVOTE & Follow ME.
THANKS!
Very educational since I'm a newbie in trading. How do you calculate the zero line? Is the upper line always 46,24 and lower line 24,64? How does this relate to Fibonacci lines?
Thank you for your reply. Fibonacci lines are based on predefined numbers that may or may not have a relationship to the underlying stock or crypto your following. In comparison, these lines are constructed directly from the underlying security and its own critical mass.
I will be presenting more examples in the coming days and providing the lines ahead of time so that everyone can follow along as the trading day progresses.
Looking fwd to those.
Can you also share what algorithms you use to calculated the lines? Or is that your own trade secret?
Congratulations @hive-mind! You have completed some achievement on Steemit and have been rewarded with new badge(s) :
Click on any badge to view your own Board of Honnor on SteemitBoard.
For more information about SteemitBoard, click here
If you no longer want to receive notifications, reply to this comment with the word
STOPBy upvoting this notification, you can help all Steemit users. Learn how here!
I'm more for price action. I can see how you discuss edge that you get it though. Very interesting to see what you come up with next. Welcome to Steemit :)
Thank you for your comment, its most helpful. Tell me what it is about price action that you follow, perhaps I can add to your methodology.