Technical Analysis Bitcoin (BTC) 01/27/2018
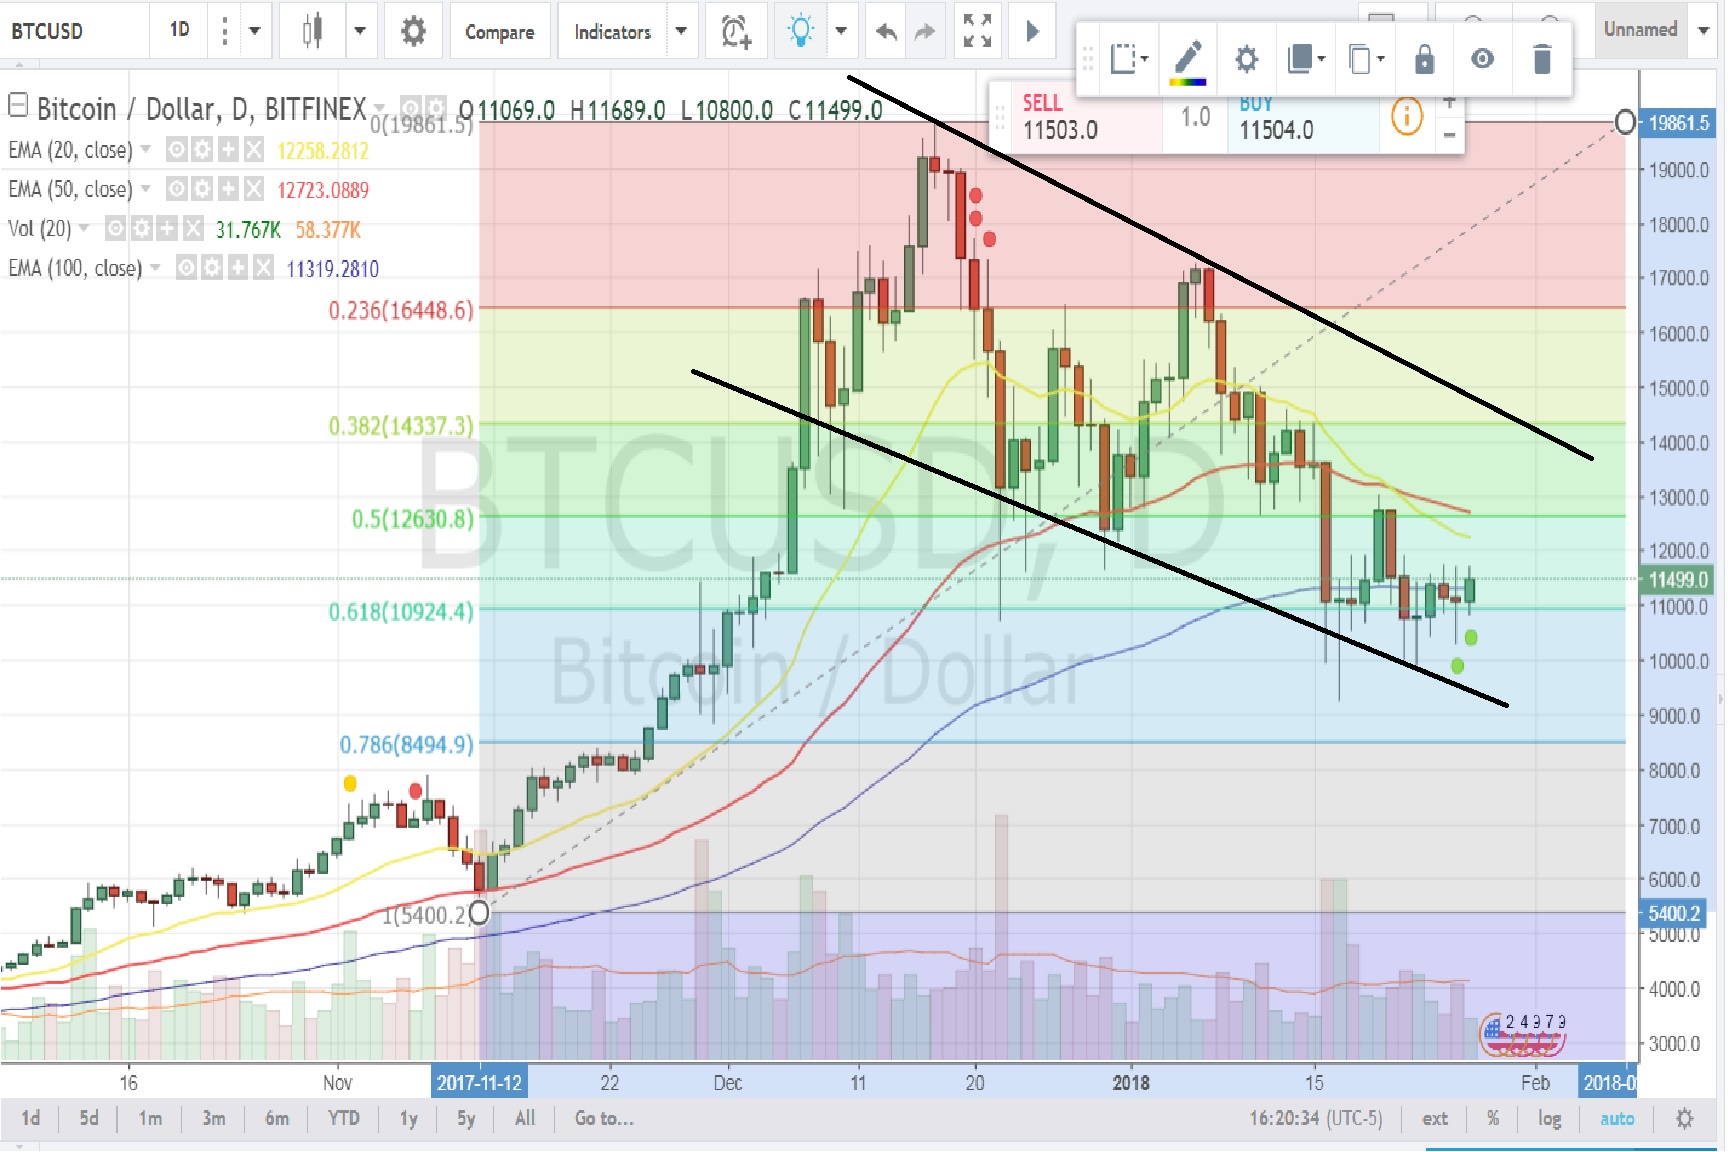
Bitcoin has been consolidating around its 0.618 Fibonacci levels which is also its 100 EMA on a daily chart. We might see a leg up towards 14k region.
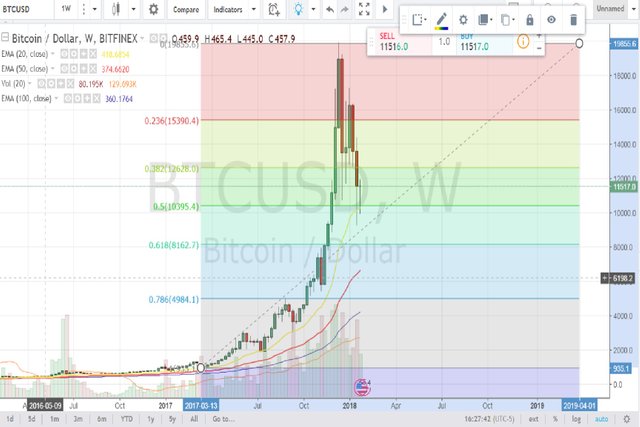
On a weekly chart, it is holding its 20 EMA quite well. Which is an indicator that the trend is still up in mid to long term.
Good Luck !!
Disclaimer :
This post is my personal opinion and is provided for informational purposes only. Don't consider buying or selling any crypto currency without conducting your own due diligence.