BTC - Where's the bottom?
Anyone with any holdings in BTC, or any other cryptocurrency that gets dragged about by it, has been eying the charts for the last couple of weeks trying to work out where the bottom is.
Over the course of the last month or so, the price movement has created an almost perfect double top on the graph. For those of you blissfully unaware of WTF a double top is, this pattern is formed when the price meets significant resistance in the form of sellers and falls back from the peak to form a trench before trying, and failing, again. The second peak will generally not meet the high of the first peak as investors will bail out before it does and that rise will likely be on weak volume. The double top is a strong indicator of a potential reversal. i.e. That the price is going to go down.
A double top is confirmed when the downside of the second peak drops below the trough. This happened on the 8th of March.
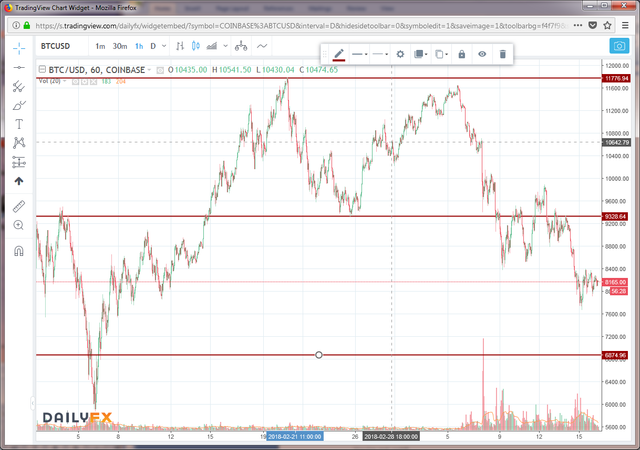
About now, those of you holding BTC or other flavours of crypto are looking at the horizontal lines on this chart and saying to themselves, there's the top... there's the trough... WTF is that other line waaaay down there?
That's the bottom. Potentially.
See, the way to calculate the damage a double top is going to do to your sweet little investment is to subtract the trough from the peak and then subtract the same amount from the trough to find the bottom. Peak to trough was 11775-9324=2451 Subtract that from the trough and we have our potential bottom 9324-2451=6873.
Observant readers will have noticed that I don't say this will happen. I say that potentially, this is where we're going. It's not possible to say with absolute certainty where an instrument is going. There are too many external factors. Good news, bad news, regulators, governments and large investors will all move the price even against the trend. So all we can do is say, I think that's where it's going and this is why.
Beware of anyone who tries to persuade you otherwise.
So, all things considered, 6873 is where it should bounce. It may well move up again in the meantime before falling back. It is pretty oversold and is unlikely to go down in a straight line.
Which is where this chart comes in.

That green line rising from left to right is the support line dating back to July last year. It's a strong line, it's been touched only three times (every touch weakens it) and it's coming up around about where our new support line sits (the bottom horizontal red one). That's two heavy supporting lines to bounce the price off. If it breaks one, it still has to hit the other.
On the 28th, they meet and will provide powerful support. If the price were to touch down there, I would be confident enough to get back in 100%. Otherwise, I'd only go 50% for now.
Why?
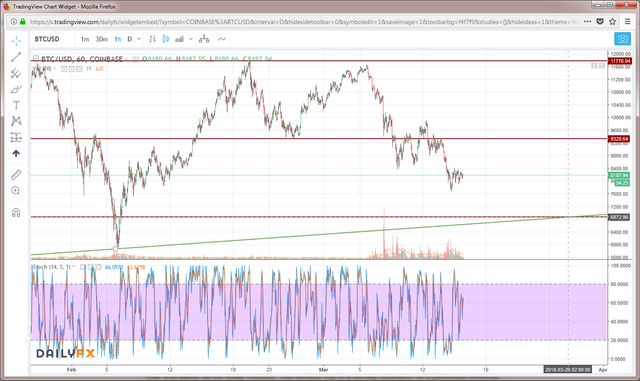
On the 28th of February, BTC hit 5873 (big stabby movement on the chart with the little white circle at the point). There's a chance that we may revisit that. If we do, then it should be a hell of a bounce and we're potentially heading back up to 16,000+ on the back of it. That's where I'd put my other 50%.
But then, WTFDIK, right?
Do not take this post as any kind of trading advice. I'm a writer, not a fucking technical analyst.
This post was prompted by a discussion late last night on The Writers' Block. Some people didn't understand the details without the visual aid of charts. Hence the gentle breakdown here.
I'd pay money to read your crypto analysis in the future. Actually very informative and educational. But then, WTFDIK. I just like to read chart activity described as 'stabby movements'.
I was going to describe the double top as "Boobies. And we're going down from here." but thought I'd keep it professional.
Good call. One shouldn't need to show proper ID before reading a market analysis.
Hehehehe, you should have,
I'm with @negativer about the stabby movements XD
Plus, I know nothing about crypto, so this is helpful. Thanks! :D
Enjoyed reading this John. Having just started my modeling of btc, this is interesting stuff. Please note that the model I DM'd in discord has CL1 slightly misplaced. The CL1 origination was slightly higher than it should have been; the EXIT should indicate ~7950, not 7900. oops
Thank you for breaking this down for us. To me, crypto often seems akin to voodoo, only with less nail clippings, hair, and chickens. This makes the recent plunge understandable.