Price Structure On Bitcoin

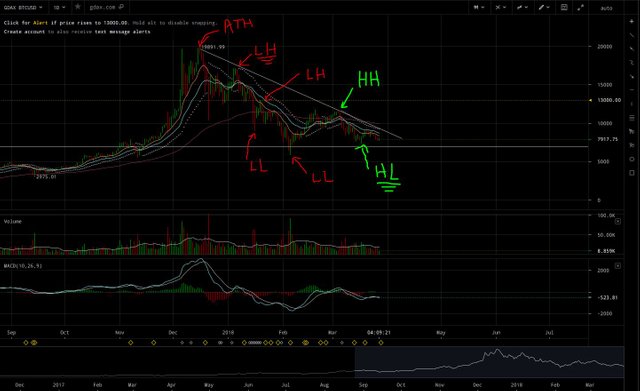
In the intro picture, I pointed out the structure building on the daily chart. ATH = All-Time High, HL = Higher Low, LL = Lower Low, HH = Higher High, LH = Lower High. In forex, we usually have some sort of method to identify a reversal on the micro level and then compare the price the reversal took place on a macro level to tell if the reversal is legit or not.
So here's the scoop. Bitcoin has been in the bear market for a while now, but there are fundamental and technical reasons why we might be seeing some bullish movements soon. Before I start my analysis I want to make it very clear that I don't pretend to hold some magic crystal ball that tells me everything. I am giving my analysis based on basic trading principles that I've learned while trading foreign exchange market. Although these two markets behave very differently there is overlap. The psychology of the trader does not sway too much across markets and/or time frames. With that said let me point out what I see.
1. Price Structure

source
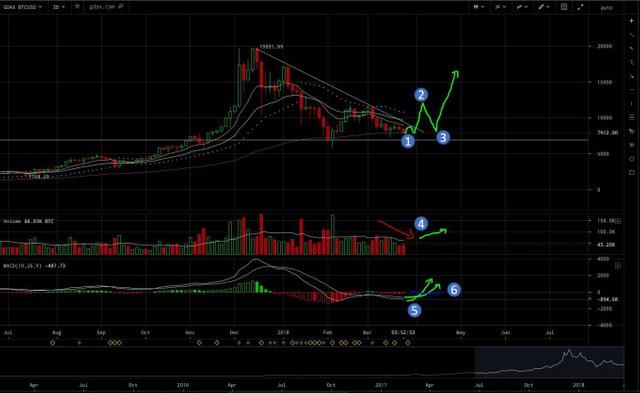
1. Resistance:
The bears are still in control. A big indicator that this is starting to change is by watching whale calls. This is the one I use and you can see the whales lower or increase their positions and in what direction. This will be a tight movement with an increase in volume followed by a sharp momentary plummet in volume which I'll explain in 4.
2. Higher High:
The obvious previous movement is a Higher Low, but we don't know where this will be yet. It needs to be above the previous high in order to be confirmed. There might be jittery movements in the market that will trick you. Often times traders get anxious and make mistakes. Think of a fisherman who casts out his line and has been waiting for a very very long time. When the bobber moves with the waves the mind starts to think that this means there is a fish on the line, but its just the mind playing tricks. When you have a fish you'll know it. Be patient. If you're a swing trader this will be your time to catch a profit right before the next movement.
3. Bull Trap
This one I'm not always sure of. Some markets have bull traps some don't. It's important to note that a bull trap should not close lower than the previous low. If this happens to watch for the next high and if it closes LOWER than the previous high then this is a false breakout and prepare to enter the bear market again. The definition of a "trap" is a quick profit from whale investors. Weak hands will think that the market will moon, but it's quick easy money.
If it closes higher, or right on top of, the previous lower then we have a confirmed liftoff. This is the perfect time to buy. We have broken the descending resistance trendline and we have confirmed market structure built up. The next move should be a sharp bullish rally. Once we have everyone on board then the other investors will get the word and move with the market. No one wants to be first so this will spark new investors that have been sitting on the sideline for a while just waiting for the confirmation.
4. Volume
So I mentioned how volume also plays into my analysis, but let me break it down a little more. This is a way of confirming the price trends. How does someone really confirm a market rally? There are four different things that can happen.
- Price increases, volume increases - This is a confirmed trend. People are buying the shares up and there is an increase in demand.
- Price increases, volume decreases - Don't trade. Volume is lowered which means demand has decreased yet price increases. The only explanation is whales manipulating the market.
- Price decreases, volume increases - This is a confirmed trend. People are panic selling to exit a trade. They need someone else to take the trade so they lower price in order to fill their open positions.
- Price decreases, volume decreases - Don't trade. This is a weird situation where whales are now exiting their positions.
In a regulatory high cap market, you can also see the bid-ask spreads fluctuate which confirms volume. I talk about this event in a previous post which I attempt to explain why we observe Heisenberg's Uncertainty Principle. This also is why I refuse to follow Fibonacci ratios in any crypto technical analysis. The volume fluctuations need to be pre-determined and consistent. Because crypto is unregulated there are no set trading hours and thus will have no Fibonacci ratios. Any Fibonacci reversals are pure coincidence or acts of placebo. With such low market cap and lack of regulation a big investor that says there will be a market reversal at "This price and this ratio" could have a big enough audience to manipulate the market. This is a self-fulfilling prophecy not a fibanacci reversal.
In event #1 we should see an increase in volume, followed by low volitility and sharp decrease in volume. The big investors will open large positions and break the resistance floor. We can confirm this with whale calls and no spike in volume. Debatably any big investor would spread out their positions and that is why we see a floor start to appear in market structure. If you spike volume too much the retail investors will know your there.
Once the retail traders get word that the walls are down they will flood the market with long positions and you will see a large spike in volume which leads us to #2.
#3 is the big name investors cashing out their positions and gobbling up the retail investors money before opening large long positions right above the previous floor. This is your time to strike!
5. MACD Crossover
Personally I prefer moving averages, but I also use MACD. I set MACD alerts on my phone to tell me when the market is moving. Crossover between the two lines represents a POSSABILITY of reversal. It should not be used as a confirmation tool in my opinion, but that could be because I don't really understand it. This is really only relevant to micro movements.
6. MACD Center Crossover
Now this is the market mover. When you see the MACD signal crossover the center line this tells me there is a macro movement happening.
I've given you my analysis so do with it as you will. I could be a market whisperer or I could be incredably wrong. It really depends on the underlying fundamental movements. This is why I've transfered my portfolio into an exchange and if the bitcoin closes below $7,000 I'm cashing out and trading forex. The next rock bottom has been talked about at $2,000 but who knows. Anyways I hope you enjoy this article. Share if you like and let me know in the comments if I missed anything.

Hi, great post, have followed you. What do you think of the current state of the Bitcoin market?
It's pretty self-explanatory in the post. I'm confused by your question.
Thanks for talking of bull traps and your volume guidelines. I am still fairly new to crypto and have gotten trapped a couple of times in the bull traps. My first week it happened several times, and since then I have been able to recover by being patient and waiting for the next trap in a week or so. I also somehow traded out of the false bull move after the G20 conference somehow by playing the differences in ethereum and bitcoin in relation to the other altcoins but would prefer not to revisit that one again.
Although I understand how the market works in crypto I would definitely not trade it. I'm 100% a hodler. I stick to Warren Buffet's style investing. Look for the market that is most likely to outperform the economy over the next 5 years and invest in the top companies you think have the best chance at outperforming the rest.
For me, I feel like that's Ethereum and a lot of the projects under that umbrella. Golem, Steamr, Lunyr, OmiseGo, and maybe a couple others I'm an investor in. These projects probably won't be anywhere near self sufficient until end of this year if we're going by their whitepapers. Once the market becomes a little more regulated and the projects start to actually produce products instead of speculation I'll look at trading. Until then I just trade forex.
Yeah, I switched to Hodling as well.