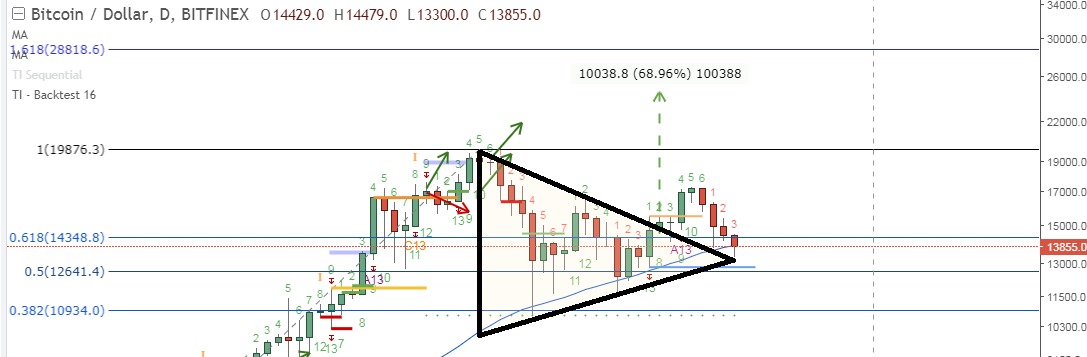
BTC update - Symmetric triangle upwards break, pulling back to the tip before TAKING OFF.
A symmetric triangle in trading usually pulls back to the tip of the triangle after breaking out for the first time.
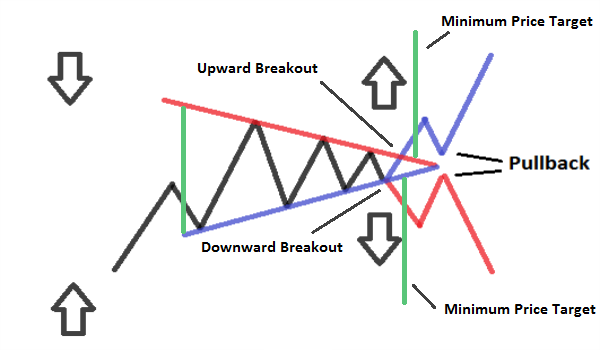
I believe this is what we are seeing with BTC at the moment.
The vertical green line was my first impulse and should be moved to the tip.
All of this could just be sideways movement for all we know, giving the alts time to swing!
Please show some love to a newbe in the community :))
We are still bouncing off the tip
this is the 2h chart
Charts are a little unreadable. I miss period length( day 4h 1h??) and date to compare with my charts to give you some more info or meaningful comment. Anyway upvote you man!
Check this my TA blogs and analyses. I start some projects and initiatives here on Steemit : Bitcoin: #22, #23, #24, #25, #26, Steem: #5, BitShares: #6.
Start movement Upvote Myself no More and series For Better Steemit: #1, #2, #3, #4.
TFDSRE series: #1, #2, #3.
Thanks for the feedback... the BTC chart is on it's day candles.
This is not an in depth analysis, I am just trying to make the one point :)
ok Stay tuned!
Solid post
thanks!
Things are looking up for bitcoin price @louwtjie
slow and steady does it ;)