Bitcoin next move? Technical Analysis
The technical analysis of bitcoin looks like this:
Head and shoulder:
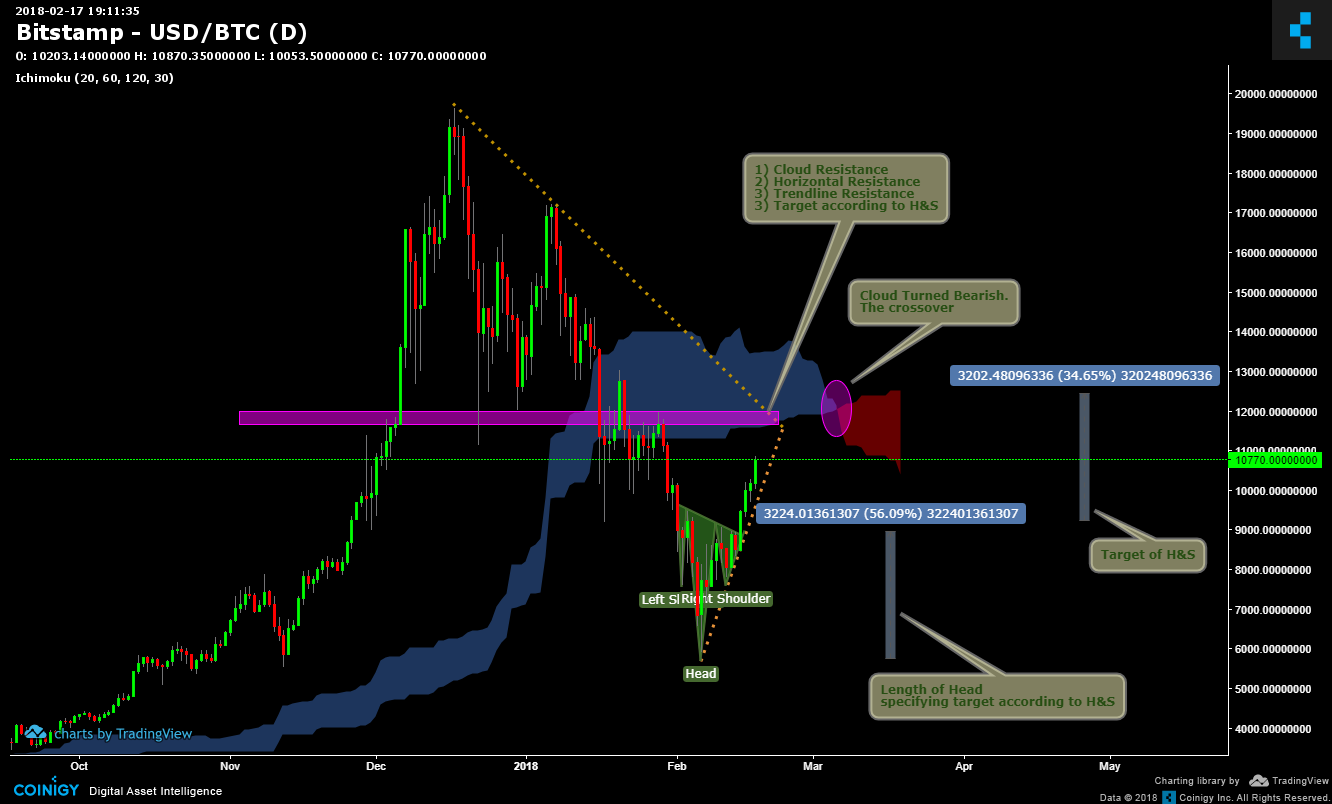
So we formed head and shoulder pattern in 1 day time frame few days back. The head having its low at 5500.
Sharing a little bit info here, Head and shoulder pattern in a down trend indicates bullish reversal and the target is equal to the length of head.
So according to the length of the Head we might go to 11700.
Strong Resistance:
Strong resistance zone is present at 11700 due to the following reasons:
1) Resisting Trendline:
Resisting trendline is offering resistance at this zone. Bitcoin has already tested this line two times and this time it will also test it.
2) Cloud reesistance:
Ichimoku cloud resistance is also present in this zone.
3) Horizontal zone:
Looking at the wicks of candles, horizontal resistance zone is also present here.
4) Head and shoulder Target:
This target also comes in the same zone at 11700.
Bear Run:
We will have bear run till 4200. Still sticking to my statement. Whales are still waiting for entry thats why we have btc dominance of only 36%. THe main reason of this is also the cloud crossover mentioned in the chart. Cloud has turned bearish for the first time after 15 November 2016 in 1 Day timeframe.
Short term Bull run:
I said earlier in this post that we will test 11700. THe main reason of this is that in 4 hour timeframe the cloud has turned green which indicates the bull run for short term. Also a trendline has been broken.
Welcome to Steem Community @mazharkazmi! As a gentle reminder, please keep your master password safe. The best practise is to use your private posting key to login to Steemit when posting; and the private active key for wallet related transactions.
In the New Steemians project, we help new members of steem by education and resteeeming their articles. Get your articles resteemed too for maximum exposure. You can learn more about it here: https://steemit.com/introduceyourself/@gaman/new-steemians-project-launch