Bitcoin price levels for 9/21
Here a simple review of BitCoin (BTC) charts for your review. This first chart is a 4 Hr chart and it contains fibonocci retracements from the recent swing low on 9/17. So for the last day the trend has been lower. Today it broke thru the retracement levels and now has bounced above the .786 level. If you want to go long then place your stop around $3,865.

Now look at the second chart below again a 4 hr chart and this is a fibonocci retracements from the high volume swing low on 9/15. I am now thinking the BTCUSD price will head lower to the $3,411 level and when it gets there we can look to see if we want to go long.

As I said before we are thinking it will test the high on 9/2/17 so lets see what the next few days reveal to us.
Comments and questions welcome
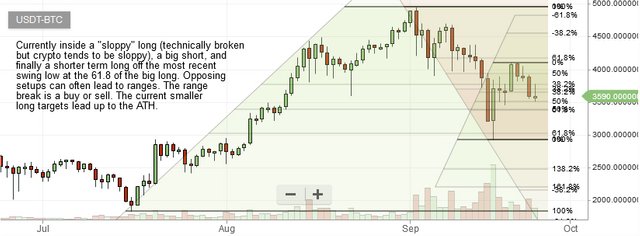
I'd prefer a clean reversal off the measured move 50% halfway back at 3550. 😎
Well as of 8:45 EST the price is right around the $3,551 the 50% retracement. I usually dont follow the 50% values but I know they are there. Lets see what happens later today.
I really like David Halsey's method. A very nice complement to other tools. 50% is the buy, and 61.8 the stop. On the big dailies, entries are only confirmed by good setups on the 15 min. Them's the basics. Then you've got measured moves and extended, and series of either. "Anchors" are where you draw from, the last swing low to recent recovery highs, for example. You buy the 50% retrace on 15 minute confirmation in pair positions, sell half at breakeven and the rest at the -23.6. That's only for starters. Check it out.
http://eminiaddict.com/
He's trading the S&P mini. Crypto often goes to the -38.3 and -61.8. I often let it ride until getting a sell signal, which comes in exact opposite fashion.
Current BTC:

Thanks for the info I'll check it out
We're possibly setting up on the 15 minute chart.
You got your buy at the 50% and it has rallied nicely since then. Did you get in last week?
I was already back in on a couple of previous buys, with an average price more or less the same as the pullback to the 50% price. And you?
nice and simple chart.
@mustang got you a $1.5 @minnowbooster upgoat, nice! (Image: pixabay.com)
Want a boost? Click here to read more!