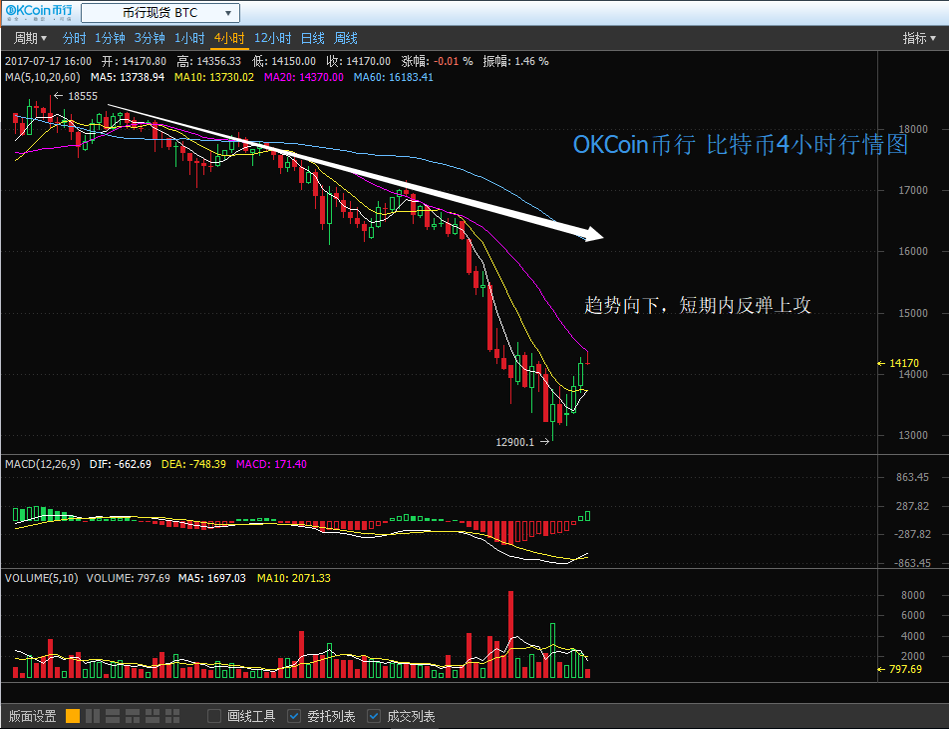
Short bounce in the trend
According to the well-known domestic digital asset trading platform OKCoin currency line of data show that today's bitbell prices bottomed out, the highest rose to 14356 near the long power slightly weakened, but the market is still in the upside; Levin currency prices rely on the bottom of the form Attack, the maximum arrival of 292 near the long power slightly weakened, a small cycle of double-headed form; Ethernet Square currency prices continued to rise, relying on short-cycle moving average system support, the success of the station to the MA60 above the line. As of today's press release, the bitter currency prices successfully stand on the 1 hour TMA60 above the line, the latest trading in the vicinity of 14222; Levin currency prices rose, relying on moving average system support upside down, the latest trading in the vicinity of 285; Shock rose, long power slightly attenuated, the latest trading near 1189. [Technical Analysis - Bitcoin] Resistance 1 14550 Resistance 2 15500 Resistance 3 18000 Support 1 13000 support 2 12000 support 3 10000 Days, the 4-hour level, moving average short-term downward trend, k-line graphics in the MA60 moving average below the vulnerable area, oversold bounce force appears; 1 hour level, moving average short-term trend pattern arrangement, the typical bottom of the stable shape, the market Open rally up rhythm. In summary: the market trend of the trend pattern, k line graphics continue to down the risk of large, short-term oversold bounce upside-based, long upward strength gradually weakened signs, short energy savings slowly. Short-term view for the long-term participants are not too high to participate in the value, do more contrarian operation, do not blindly enter the bargain-hunting; short-term investors to rebound high point short strategy. Concerned about the pressure near the 15000 bit, if the market rebounded to the location of signs of failure, can be a rebound opportunity to vent empty, strict stop. Resistance 1 300 Resistance 2 325 Resistance 3 350 Support 1 250 support 2 230 support 3 200 The K-line pattern is in the vulnerable area below the MA60 moving average system, the long rebound force gradually weakened; 1 hour level, the average system short trend arrangement, the trend line is short, K-line graphics in the average system above the multi-rebound force gradually weakened. In summary: the market trend of the trend pattern, relying on the bottom of the form, bulls continue to rebound, but the bulls gradually weakened, the market trend can not shake the short. Short-term investors in the long-term long-term participants are not very good bargain-hunting, do not recommend blind participation; short-term investors to rallies short strategy-based, attention to 300 near the pressure position, if the market rebounded to this position after the bull failure Signs, can be the opportunity to rebound light warehouse empty, strictly stop.