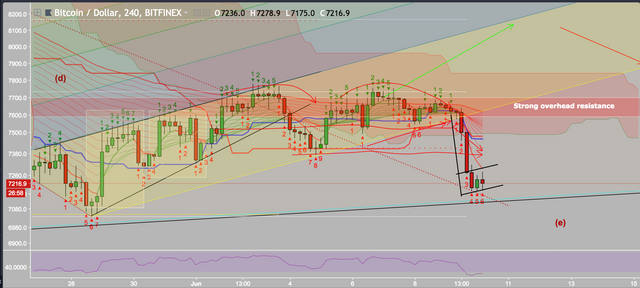
Bitcoin TA: June 10th, 2018


We've got the 4h BTC chart above. I mentioned in our webinar that we'd pretty completed our double top (bearish) pattern. And if we broke down under $7500 we'd have a quick drop beyond that. As the next support is near $7200-7300. The RSI has pretty much bottomed out on the 4h time frame. And as you see we're printing a bear flag (upside down flag in black) and these typically break to the down side. The rising support line from last year is right under us at $7200-7100 level. This is critical for us to hold. However, the probability favors the bears to eventually break this. It will happen, in my opinion, just a matter of when. For now, we're printing the 6 of 9 red candle as shown. The TK bear cross has already happened on the Ichimoku cloud. This may be a rough weekend but we've been calling this for a while now so hopefully you've followed our calls and are happy to watch the price keep sinking. I still do not believe we've found a bottom yet. Creating a base in the $7000 range was already dangerous so now the bears are making the bulls pay.
Go here https://steemit.com/@a-a-a to get your post resteemed to over 72,000 followers.
MM have wanted this lower for weeks. No buyers. https://steemit.com/cryptocurrency/@heyimsnuffles/crypto-carnage-is-imminent-20180610t190128430z-post#comments