Bitcoin TA: June 4th, 2018
TA from a trusted analyst
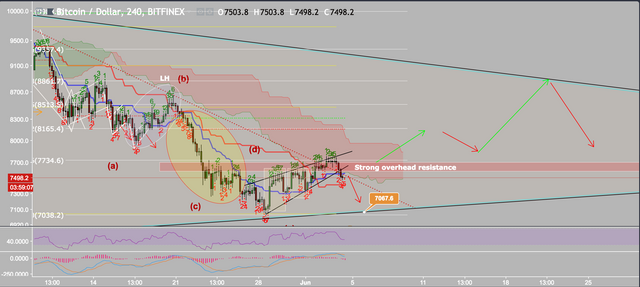
We've got the 4h BTC chart above. As you can see that 'Strong Overhead Resistance' zone was ultimately the area that brought us down on the current wave, no surprise at all. We also tried to pierce the Ichimoku cloud and falling out of it is another sign of weakness amongst the bulls and strength being on the bears' side. The RSI and MACD have turned bearish. And also, we fell out of the rising wedge as expected. The TD sequential has started it's 9 candle countdown for this bearish corrective wave. We're on candle 5 as seen above. We could also expect a small bounce at candle 7/8 as this could be a five wave impulse and this current impulse being wave 2. But seeing as we failed for a strong 24 hours trying to break above $7700 I do not have confidence in the bulls. This is another reason why I have not recommended a strong buy for BTC. This market has not given us a reason to enter. Be patient. It will pay off. I promise.
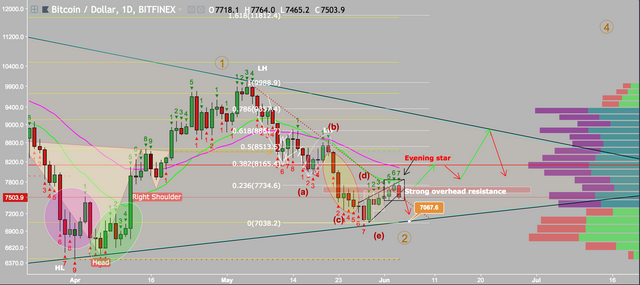
The daily chart shows a candlestick pattern called Evening star (bearish). It is not perfect as the preceding candle to the 6 candle needs to be a bigger bodied bullish candle but I am confident this is a evening star pattern. If we break down to $7440 or so we will have turned the TD sequential to a red 1. Indicating further downside for the next few days. As I had mentioned in my previous days' analysis that you want to wait to buy into BTC after you've seen it stand on top of the $7700 resistance zone strongly. It clearly did not. Thus we stay out. Confirmations like that will save you $ and profit % in the long run. If you took my word, you will have saved some $ and stress. The VPVR also shows heavy sell pressure indicative by the purple part of the volume profile bars (on the right). If we open the next daily candle under this current red bearish candle we will have confirmed our evening star and we will most certainly head down further.
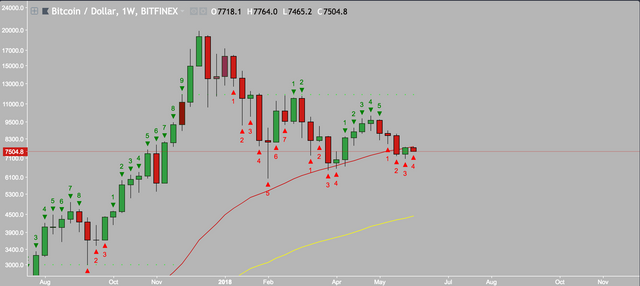
The red line is the 50 MA weekly. Our current red 4 is under it and will need to break above $7850 and open a new candle above $7900 for us to get above the 50 MA. This looks unlikely over the next few days. When I say that we are in a large bear market, the weekly chart shows you what I mean.
Thanks for the BTC analysis @quantalysus, can't wait to see the bulls rise again! We have something in the works that could help your work get more exposure, and possibly more profit as well.
Check us out and follow us and I'll make sure you get a free trial.
About us: Introduction and Leverage TIMM for profit.
If you are interested in becoming more involved, chat with us: Discord
Cheers!
Thank you @quantalysus
https://steemit.com/success/@neliohaiti/kek-bagay-moun-ki-reyisi-yo-pa-janm-fe
Hi @quantalysus, it seems you are really interested in bitcoin! Maybe it would be interesting for you to check out my bitcoin t-shirt design here:
https://teespring.com/bit-to-the-moon
Thanks for your attention and have a great day!
Thanks for the TA
NP!
Love trading? The best app for this is https://masscoinapp.com
Any questions? Telegram support: https://t.me/masscoinsup