Bitcoin TA: May 25th, 2018
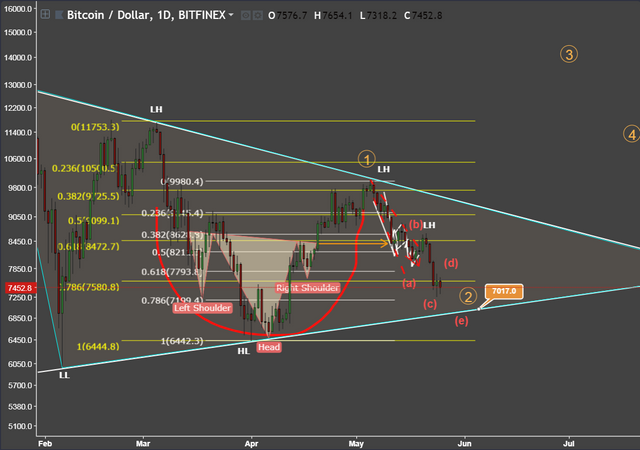
You're looking at the 1D BTC chart above. It is now safe to assume that both the bullish patterns of the Inverse H&S and the cup & handle are now invalidated posted a couple of days ago. Why? The current price action has breached the neckline and the body of the I H&S and the cup & handle was breached >50% of the way. We see the corrective wave still at play but it has now turned into ABCDE. If we stay within the bounds of the symmetrical triangle that means we should bounce up from E. And if we take our June 6th theory into account we'd bounce in the $7,000-7,100 range. All indicators look bearish and there is no reason for me to look at those right now as the sell pressure is high and the current price action is playing out exactly to the tune of our drawn fractals chart as well as monthly 6th chart (scroll up). Further downside is expected.