Bitcoin TA: May 28th, 2018
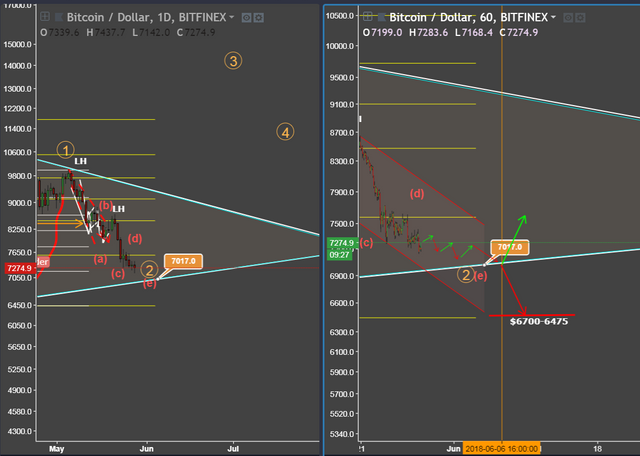
We've got BTC 1D on the left and 1h on the right. The chart on the left will show the slow decline in price day by day. The volume (not shown) has been dismal on both the bulls and bears. Thus you see the break down of price on a very slow rate. The hourly chart shows the movement of each level where the buy orders are met at different levels. However, the bears are dominating this $7000 range. I've drawn some arrows to illustrate how I see the movement for the next few days. Meeting at the decision point of that rising trend line will be the point at which we decide the next few months of Bitcoins future. If we hold at the price marker shown $7017 or so we will have created a higher low from April. And as per our monthly 6th theory, we should bounce up to $9k (possibly). However, breaking the symmetrical triangle will mean we either hope to create a double bottom as per the April low of ~$6700. Breaking down further will ultimately mean a longer bear market for the next few months. Creating lower highs and higher lows is a clear indication of that.