Bitcoin TA: May 29th, 2018
TA from a trusted source:
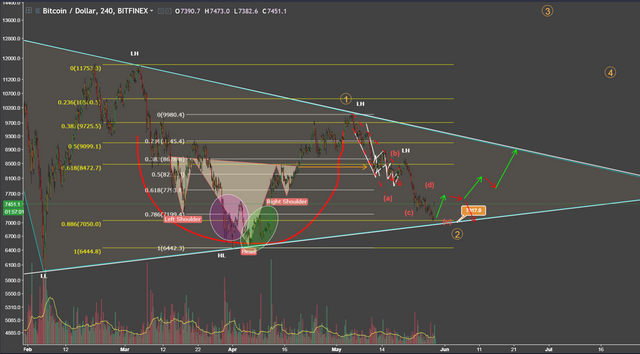
We've got the BTC 4h chart above. Looks like we found some buyers at the $7,000-7,100 range. On the 4h hour chart as you can see we may be playing out the purple or green ellipses highlighted. However, it's important to note that we did not bounce off a trend nor off a local fib. So bouncing in this no man's zone does not give me confidence in saying this is a true bounce. We also don't have confirmation yet. Just one 4h candle that looks strong. Going back to the purple ellipse highlighted, you can see that we also found a bounce in that zone but then had a large bearish engulfing candle that took us down and then we moved sideways to finally bounce back up strongly (green ellipse). We need to see the path BTC takes over the next 24 hours. I've highlighted some arrows of the path I think it will take. The volume is dismal and does not show signs of reversal, so I'd be more inclined to think this is a dead cat bounce which usually signifies a temporary bullish bounce but is really a trap that leads to continuation of prevailing trend.
Interesting analysis. Thanks for sharing.
Thanks for reading!