Bitcoin TA: May 31st, 2018
Technical analysis provided by a trusted source.
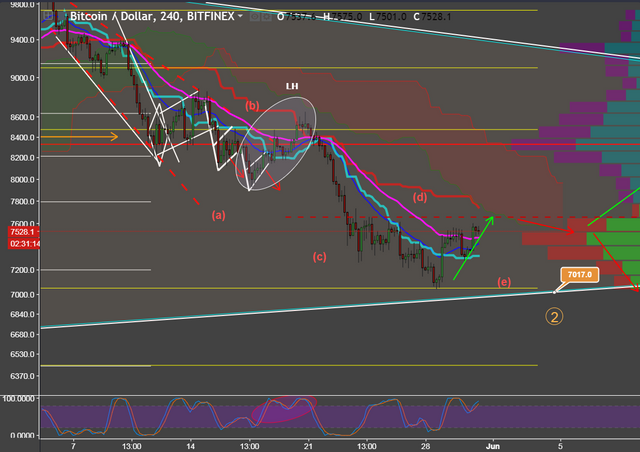
We've got the 4h chart of BTC on Bitfinex exchange. There's a lot of things happening in the chart so let me break it down one by one. Something easily visible on the chart is the volume profile of visible range (vpvr) on the right. There were a few people trying out this indicator so I thought I'd give it a shot. Essentially it shows the buy volume (green and blue) and sell volume (red and purple) in a given range of price. As you can see the sell volume has been quite high in the current $7400-7600 range. This indicates that there are a lot of sellers and they outweigh the buyers. Working through this range is going to be tough so we will need strong bullish volume to surpass it. In addition, we face a resistance level from the previous support at the dashed red line. This is around the $7700 area. On top of that we will be facing heavy resistance with the Ichimoku cloud and the Kijun-sen line (red) around the $7700-7800 zone. The 40 EMA (pink) has still not crossed under the 20 EMA (blue) to give us a bullish cross signal. This is indicative of an environment that isn't truly bullish. As mentioned before this cross on multiple time frames (1h, 4h, and 6h) produces a strong buy signal. We are not there, yet. I'd like to direct your attention to the two ellipses in the price action and the stoch rsi (bottom of the chart). This matches the current movement of price action as our stoch rsi is quite high (overbought). So if the previous ellipses says anything of what lies ahead, we could expect further downside. If you are trading BTC I'd advise you to set a tight SL or a looser one at the tekan-sen line (light blue) around the $7306 marker.
There have been a lot of folks asking me about my 6th theory and how it's been floating around the internet. And because it's floating does that change my strategy. Well, my trading strategy was never entirely based on 6th. That would be unwise. Our investment and trading strategies are always going to be multi variable. Fibonacci levels, general price action reading, host of indicators, and pattern recognition such as the 6th theory are all considered when entering or exiting the market. So with that being said, our 6th theory just happens to work out the way I've noted in my charts. It may or may not work out exactly. Does not matter to me. Thus far I have not seen clear signals to enter in this market. But again, if you did, set tight SL or at the stated tenkan-sen line above.
My job for myself and you guys is two things: 1) Capital preservation 2) Least risk and most reward when entering positions
I am not in the business of catching falling knives in this market. I like my heads very much. Losing a few % is fine by me.
Resteemed by @resteembot! Good Luck!
Check @resteembot's introduction post or the other great posts I already resteemed.