DASHUSD - Technical Analysis October 14, 2017 - Current Price $314

DASHUSD
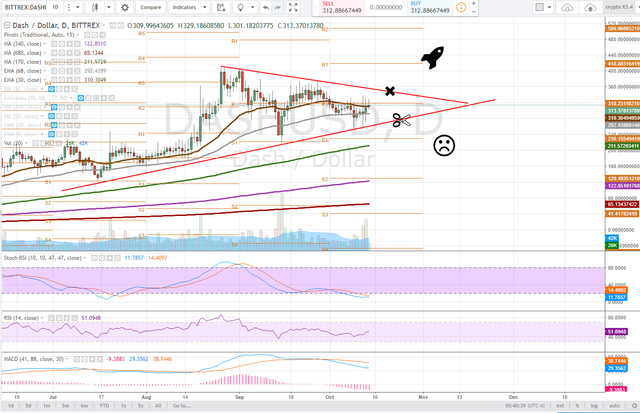
We were looking at DASHUSD 10 days ago and with a pragmatic approach determined another dip was likely before a run-up based on the chart formation - a pennant. Since DASHUSD has tested the lower trendline twice and bounced up into the middle.
A pennant formation is indicative of a possibly explosive move by the trendline apex, but when symmetrical, they do not denote direction.
daily
After testing the lower trendline twice DASHUSD has bounced up to test the 30ema and daily pivot, a reversal Doji candlestick is currently forming, however, there is a lot of time left in the day.
Looking at the daily stochastic RSI, its beginning to curl up along with the RSI and following an increase in volume. Volume is often a misinterpreted indicator and is simply the statistic about the number of transactions that occurred in the time period. For every seller there is a buyer and vice versa.
If the price can reclaim the daily pivot, $318, then a test of the upper trendline is likely. Bulls would hope to see a cross above, backtest and hold of this range for breakout confirmation, otherwise we may again test the lower trendline. Losing the lower trendline gives way to the low $200's.

4 hour
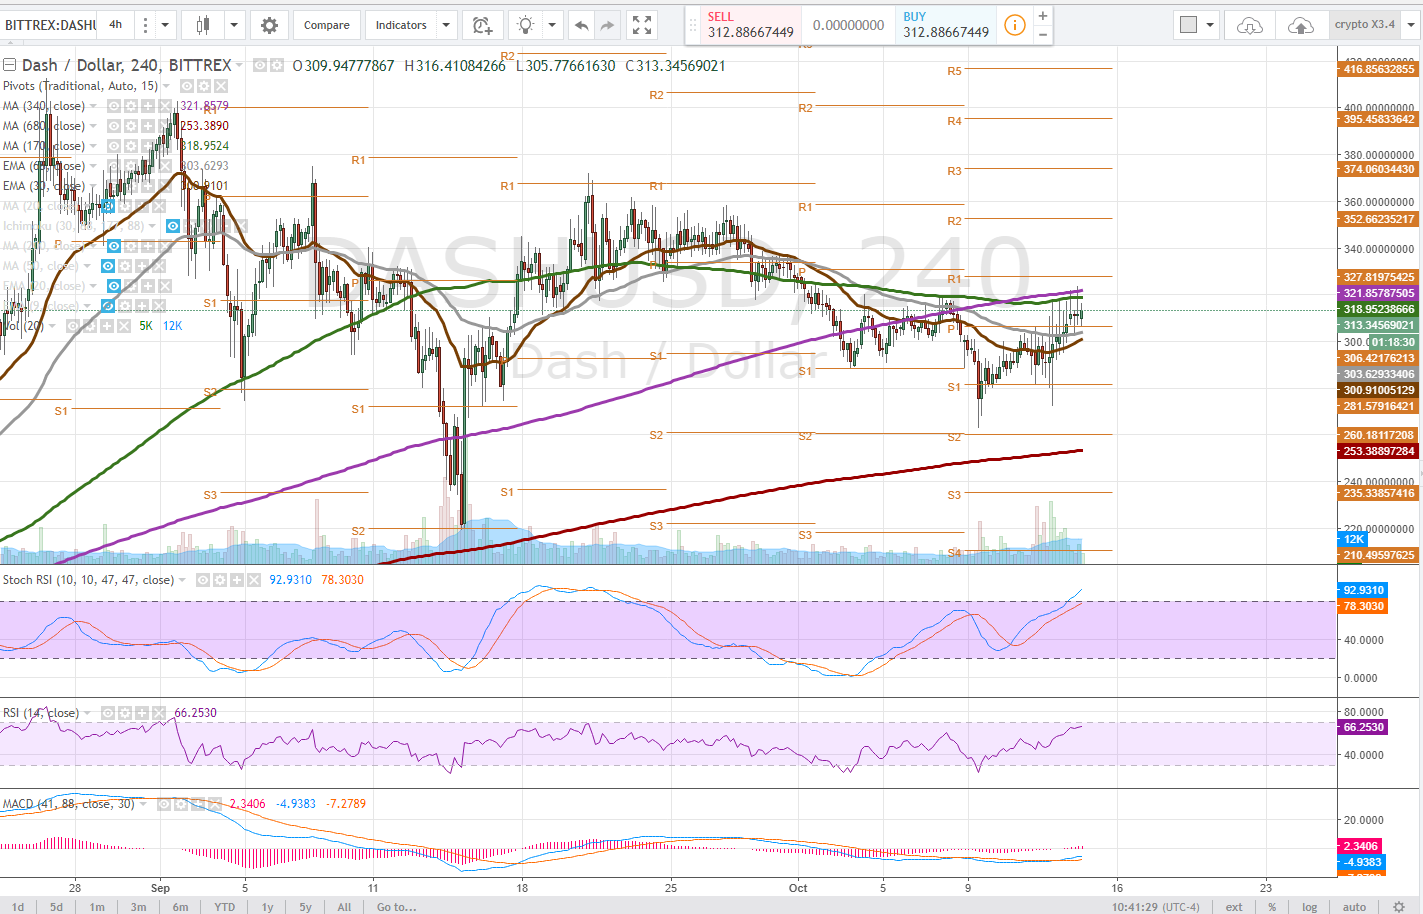
The 4-hour timeframe demonstrates the support found at pivot S1, $281. Where the price had begun to bounce and set a series of higher highs and higher lows in each candlestick, which is bullish price action and shows the ASK price rising.
Consolidation is occurring here above the pivot support $306 and we are observing some bullish curling in the 30ema (brown) and 68 ema (grey). The 30ema above the 68ema, a bullish cross would be conducive to longer-term price progression in this time frame.
The stochastic RSI is just reaching uptrend and the RSI and MACD are both bullish. After some consolidation, bulls need to see another push higher, or a higher low is printed, which would be a dip buying opportunity and representative of that kind of sentiment. Losing $281 would printer a lower low.

1 hour
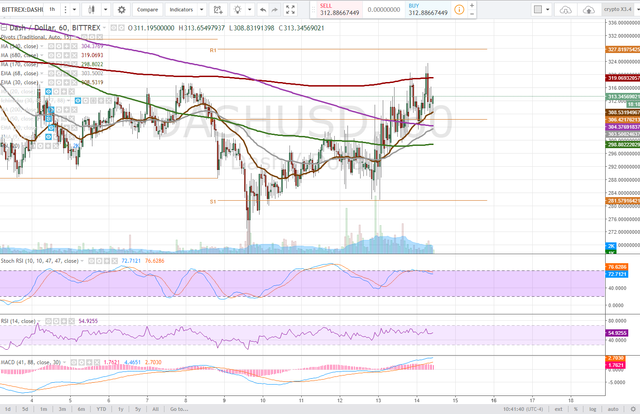
On the 1-hour time frame, the moving averages are crossing upwards in a bullish manner with resistance having been found at the 680dma on this timeframe.
The stochastic RSI hanging just below uptrend can run much further while the macd continues its bullish divergence. Reclaiming the 680dma as support will give way to a longer-term bullish trend of price. Support is currently the 30ema(brown line) since our previous low.
Losing the 30ema would give way to a pullback and possible dip buying opportunity all the way up to the 170dma (green line).

Bullish Above: $324, very bullish if a breakout of trendline resistance occurs, $340.
Bearish Below: $298, very bearish below $280 and if the daily trendline support breaks we look for the low $200's
RISK TRADE: Accumulate a long position here all the way to $298 the 170dma on the 1-hour timeframe looking for a test of the upper trendline resistance.
Don't forget to use stop losses!!!
Previous Articles:
ZECUSD
BTCUSD
LTCUSD
XMRUSD
ETHUSD
NEOUSD
BTCUSD
DASHUSD
Follow at your own risk, Not a financial adviser, understand the risks associated with trading and investing. Manage your own Risk - in other words you could lose it all and it's your own fault.

man this awesome I like how you analyze! Personnally I dont trade dash tho,, we have a love/hate relationship. Take care
Can you do the same for Steem please? I like your analysis!
I try to stick to analyzing less risky currencies, stalwarts/majors, highest market cap.
great post thanks
How awesome would it be to own a dash node
Is there a reason you do your analysis against USD instead of BTC? I've always done my trades vs BTC because I trade on 'trex (which I guess does have USDT, but then I would have to do a BTC->USDT exchange).
I think DASHUSD might be relevant on Kraken.
Can trade either denomination but USD value doesn't denote BTC value. So it depends on where one is trading and what the goal - accumulate USD or BTC.
I like both pairings personally and I think USD might be easier for some to visualize and learn TA from.