Bitcoin Daily Update (day 189)

I believe that it is possible to beat the market through a consistent and unemotional approach. This is primarily achieved through preparing instead of reacting. Click here to learn more about the indicators I use below and click here from my comprehensive trading strategy. Please be advised that I swing trade and will often hold onto a position for > 1 month. What you do with your $ is your business, what I do with my $ is my business.

1 - 5 days: < $6,000 | 1 month predictions: < $5,750 by 9/24 | bottom prediction: $3,000 by 10/30
Previous analysis / position: Slightly concerned due to btcusdshorts’ and price trading back above 50 MA. / Short ETH:USD at $285.57 & ETH:BTC at 0.04029/ Had order set to add to short at $283.24 that got filled at $264.46. Have never had that type of slippage before it is ruined my average cost basis for my ETH:USD position.
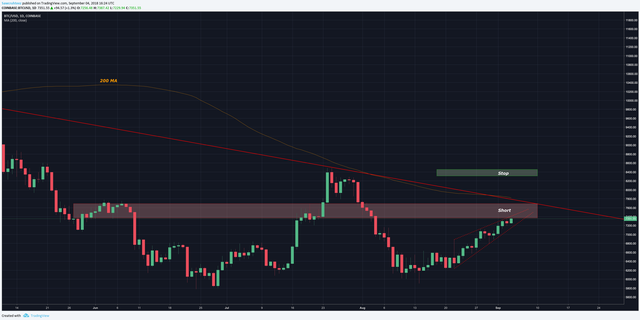
Patterns: Rising wedge inside descending triangle
Horizontal support and resistance: S = $7,350 | R = $7,386
BTCUSDSHORTS: Pulling back off hanging man, are we getting another squeeze or does it simply need to retest short term EMA?
Funding Rates: Longs pay shorts 0.01%
12 & 26 EMA’s (calculate % difference): 12 = +4.55% | 26 = +6.57%
50 & 128 MA’s: 50 = +4.3% | 128 = +1.29% | 200 MA is tracking along trendline/descending triangle
Volume: Volume continuing to fall as price rallies
FIB’s: 0.5 = $7,174 | 0.382 = $7,418 | 0.236 = $7,752
Candlestick analysis: Just took out hanging man
Ichimoku Cloud: Currently trying to re enter daily cloud. Flat top at $7,867 should be strong resistance / good spot for stop. 4h cloud is fully bullish.
TD Sequential: G4 on daily. G8 on 2d. G6 on 3d.
Visible Range: High volume nodes from $6,350 to $8,500. Top of volume area on 1m and 3m lookbacks.
BTC Price Spreadsheet: 12h = +1.39% | 24h = +1.18% | 1w = +4.23% | 2w = +15.05% | 1m = -1.23%
Bollinger Bands: Hugging top band on daily.
Trendline: Connect 8/22 to 8/30
Daily Trend: bullish
Fractals: DOWN = $6,808 | UP = $8,285
On Balance Volume: Small bear div on daily. Small bull div on weekly.
ADX: ADX broke through 20 while +DI diverges from -DI in bullish manner.
Chaikin Money Flow: Bull div on daily, however it is approaching major resistance / overbought zones. Bear div on weekly.
RSI (30 setting): W = 50.6 | D = 54.79
Stoch: Overbought on 1d and 2d, plenty of room to go on 3d and 1w.
Summary: Do not let the market lull you to sleep in the calm before the storm.
As we continue to rally on decreasing volume we are approaching major levels of resistance from: VRVP, top end of descending triangle, 200 MA, and top of Bollinger Band. Furthermore we are on a green 8 on the 2 day chart after re setting the sell setup on the 1 day.
There are many reasons to believe that this rally is becoming exhausted and there are not many reasons that I can see which point towards breaking the descending triangle to the upside.
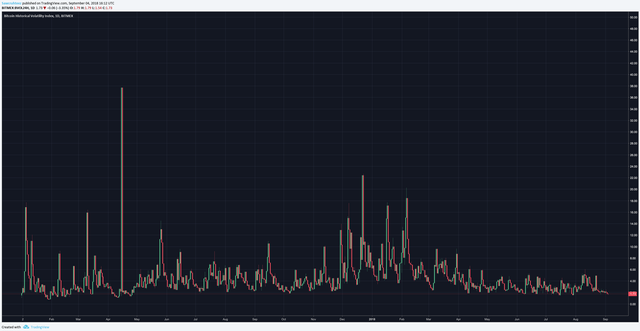
When taking a look at the Bitcoin Volatility Index it seems very likely that we are in for a major move one way or the other. I firmly believe that it will be a correction to the downside and that is a major reason why I have been calling for < $6,000 over the last couple weeks.

The calm before the storm is often the best time to build a position. Selling the current area of resistance provides a great risk:reward. Shorting alts is a better option as they continue to show more signs of weakness than BTC.
Thanks for reading!

Allow me to Reintroduce Myself...
Learn How to Trade! [part 1]
Learn How to Trade! [part 2]
Wyckoff Distribution
Bitcoin Daily Update (day 188)
Coins mentioned in post: