Bitcoin Daily Update (day 194)

I believe that it is possible to beat the market through a consistent and unemotional approach. This is primarily achieved through preparing instead of reacting. Click here to learn more about the indicators I use below and click here from my comprehensive trading strategy. Please be advised that I swing trade and will often hold onto a position for > 1 month. What you do with your $ is your business, what I do with my $ is my business.

My most recent Bitcoin Bubble Comparison led to the following predictions: 1 day - 28 days = < $5,750 | bottom prediction: $2,860 by 10/30
Previous analysis / position: “If you are not in a position and you didn’t sell the 4h bear flag then it is time to wait. If we get a bounce then you get a high percentage short. If we don’t get a bounce then you need to be okay with missing out on a move.” / Short ETH:USD. Took profit on 33% of position improving my average cost basis to $317.37 per ETH.
Patterns: Descending triangle . 4h tweezer bottom .
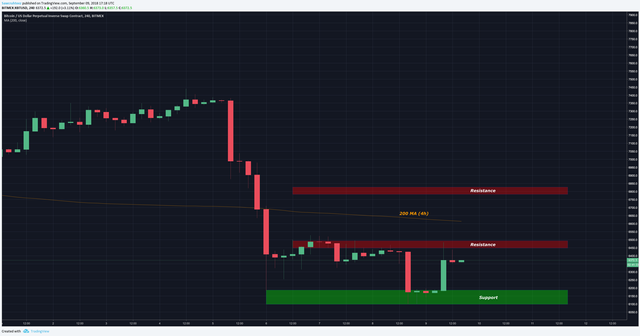
Horizontal support and resistance: S = $6,350 | R = $6,375 - $6,440
BTCUSDSHORTS: Pulling back from ATH’ retest. Interested to see if it makes higher low. ETHUSDSHORTS are off the chart and could be an indication of what’s to come with BTC.
Funding Rates: Shorts pay longs 0.0545%
12 & 26 EMA’s (calculate % difference): 12 = -4.87% | 26 = -5.77%
50 & 128 MA’s: 50 = -8.63% | 128 = -11.03%
Volume: Decreasing during consolidation.
FIB’s: 0.786 = $6,379 | 0.618 = $6,783
Candlestick analysis: 4h shooting star.
Ichimoku Cloud: Tenkan-Sen = $6,770
TD Sequential: Daily R5
Visible Range: Currently testing point of control ( POC ) with 2m - 1y lookback.
BTC Price Spreadsheet: 12h = +3.19% | 24h = =0.91% | 1w = -12.74% | 2w = -7.83% | 1m = +1.51%
Bollinger Bands: Found support from bottom band. MA = $6,777
Trendline: If current bounce creates lower high (strongly expected) then should be able to draw a trend line with the top of September 5th.
Daily Trend: Bullish
Fractals: Down = $5,869 | Up = $7,442
On Balance Volume: Moving with price / no div’s
ADX: ADX > 25 which confirms trend.
Chaikin Money Flow: Moving with price / no div’s
RSI (30 setting): W = 48.72 | D = 44.93
Stoch: Daily oversold and posturing for buy signal
Summary: We got the bounce I was expecting and now we wait to see what kind of legs it has. I have adjusted my key areas of resistance to $6,459 and $6,783 do to the following resistance cluster:
Tenkan-Sen = $6,770
0.618 FIB = $6,783
4h 200 MA = $6,615
VRVP POC with 2m - 1y lookback = $6,300 - $6,459
Daily Bollinger Band MA = $6,777
I am still expecting the price to retest the 200 MA on the 4h chart and it currently waits right in between my key levels of resistance.
If you are not in a position then opening a short with one third of your desired position size at each level of resistance should provide a favorable risk:reward.
Enter 33% at $6,449
Enter 33% at $6,599
Enter 33% at $6,777
A stop loss above $7,150 should be relatively safe based on prior support and resistance levels. Any of the following targets are realistic within the next 1-2 months: $5,500 | $4,500 | $4,000 | $3,000.
I would still suggest shorting ETH’/Alts instead of Bitcoin 3.28% . They continue to be in a weaker position which decreases the risk and has greater opportunity for reward.
Thanks for reading!

Allow me to Reintroduce Myself...
Learn How to Trade! [part 1]
Learn How to Trade! [part 2]
Wyckoff Distribution
Bitcoin Bubble Comparison
Bitcoin Daily Update (day 193)