Bitcoin Daily Update (day 201)

I believe that it is possible to beat the market through a consistent and unemotional approach. This is primarily achieved through preparing instead of reacting. Click here to learn more about the indicators I use below and click here from my comprehensive trading strategy. Please be advised that I swing trade and will often hold onto a position for > 1 month. What you do with your $ is your business, what I do with my $ is my business.

My most recent Bitcoin Bubble Comparison led to the following predictions: 1 day - 28 days = < $5,750 | bottom prediction: $2,860 by 10/30
Previous analysis / position: “This is where the risk:reward is what you should be thinking about. If it breaks through the trendline then exit the position. However if it gets rejected then it should sell off hard and fast.” (referring to ETH) / Short ETH:BTC from 0.03143 | Short ETH:USD from $211.96 | Short EOS:ETH from 0.0252326
Patterns: Descending triangle
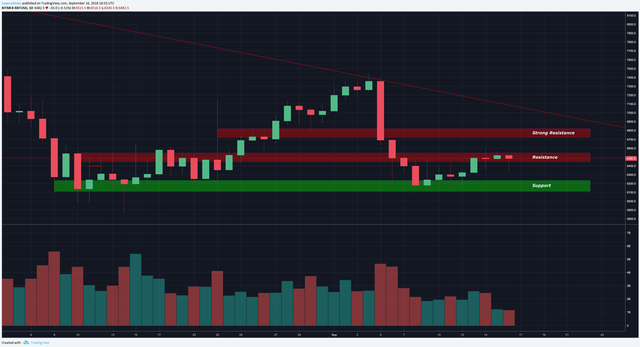
Horizontal support and resistance: S =$6,443 - $6,459 | R = $6,494 - $6,514
BTCUSDSHORTS: Still fitting into a bull flag.
Funding Rates: Shorts pay longs 0.0028%
12 & 26 EMA’s (calculate % difference): Unable to support above 12 EMA, now it is acting as resistance. 26 = -1.87%
50 & 128 MA’s: 50 = -3.85% (angling down sharply which indicates it will be strong resistance) | 128 = -7.29%
Volume: Price continues rising on low volume
FIB’s: 0.618 = $6,637 | 0.786 = $6,414
Candlestick analysis: Daily hanging man forming. Watching weekly candle to see if it can retrace > /= 50% of last weeks candle.
Ichimoku Cloud: 4h cloud continues to act as resistance. Thick cloud with flat top indicates strong resistance from $6,523 - $6,778
TD Sequential: 12h on green 9 at horizontal resistance after a hanging man. Daily green 5. Weekly Red 2 never got below Red 1.
Visible Range: Looking back to February when we have continued to test this price makes the most sense and it shows the point of control at $6,514 and a high volume node up to $6,724
BTC Price Spreadsheet: 12h = - | 24h = -0.55% | 1w = +3.76% | 2w = -10.7% | 1m = +2.43%
Expected to test MA at $6,725 after bouncing from bottom band
Trendline: Top of descending triangle = $6,925
Daily Trend: Chop
Fractals: Up = $7,475 | Down = $6,065
On Balance Volume: Starting to move downward. If it creates a lower low that would be a bear div on the daily.
ADX: Indicates no trend
Chaikin Money Flow: Starting to turn over on the daily.
RSI (30 setting): W = 48.98 | D = 46.5
Stoch: %K testing %D on the daily
Summary: The market is showing significant signs of a top with the 12h red 9, daily dojis at resistance and today’s candle creating a lower low than September 14th. The BTCUSDSHORTS are posturing to breakthrough the all time highs similar to what ETHUSDSHORTS did last week.
Continuing with the common theme I will be watching BTC and trading ETH. As mentioned above and in yesterday’s post ETH:USD and ETH:BTC are testing the 6 week bear trend line. That represents a good risk:reward opportunity for short sellers. If the trendline is broken then you can exit at a small loss. However if it hold then swing targets are $104.69 and 0.022 respectively.
EOS:ETH and EOS:BTC are both still at the top of my most overvalued coins in crypto. I was paying close attention to the ETH pair last night to see if it would break 0.0253 and I recommended that as an area to reduce position size or close out entirely. As it stands we found resistance at 0.0251 and the push back is forming a bearish wick/shooting star.
Order remains set to short EOS:BTC at 0.0007474. Click here to read my analysis on EOS.
Thanks for reading!

Allow me to Reintroduce Myself...
Learn How to Trade! [part 1]
Learn How to Trade! [part 2]
Wyckoff Distribution
Bitcoin Bubble Comparison
The Most Overvalued Coin in Crypto: EOS
Bitcoin Daily Update (day 200)
Excellent post. I will continue to follow your publications.
Excellent post. I
Will continue to follow
Your publications.
- kortess
I'm a bot. I detect haiku.
Nice analysis...as usual.
@sawcruhteez You can read ....