Here's why Bitcoin is a tsunami that cannot be stopped
When two traders are talking of bears and bulls, they are not talking about the zoo they recently visited, but they are talking about buyers and sellers.
Buyers are defined as bulls and sellers are defined as bears.
There is an interesting chart that shows you bulls in green and bears in red:
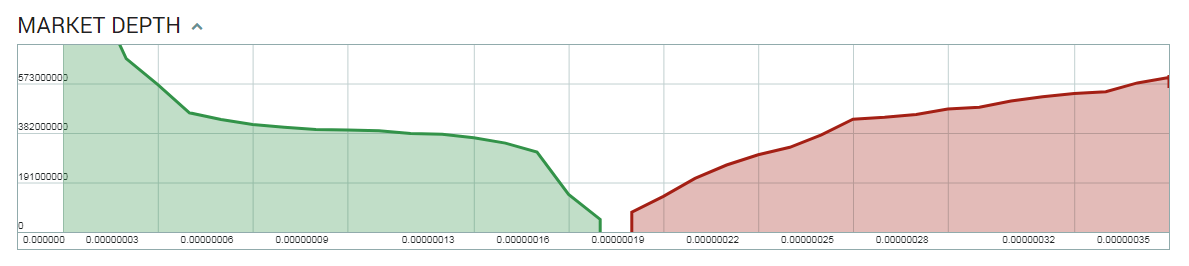
It's nothing else than the graphical representation of the current orders. This can change very quickly, however this can be very useful to find where to enter.
This chart is called market depth, and there is one in particular that is almost always the same, where the bulls are always winning. This is the Bitcoin chart, if you didn't guess it already.
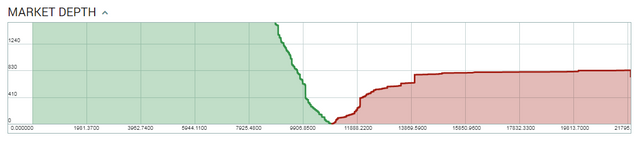
This is quite unusual and the bulls look like a wall or a massive tsunami that is going to crash on a beach. If you want to check the market depth chart by yourself, you can find it in Poloniex. However, this is what you always find, no matter if Bitcoin is falling or if Bitcoin is growing. I think this should tell us a lot about the potential of Bitcoin in the coming years.
Nice post! I upvoted and followed you. Can you check my last blog post about crypto: https://steemit.com/cryptocurrency/@cryptoizotx/crypto-market-sentiment-update-december-4-2017 ?