Looking for the best entry for a trade
When it comes to looking at a chart, you need to retrain your mind to look at what the underlying data symbolises as opposed to just looking at it as a load of candles.
In truth, the charts show us what we don't need to see: filled orders - trades that have already happened.
If you think about it, what turns price? Unfilled orders and market orders. Limit buys and sells are used for liquidity, so when you look at the order book, all you are seeing are places where large market orders can be placed, or where somebody or an institution is playing a mind game for suppression and manipulation, as written about here: https://steemit.com/cryptocurrency/@technicalanal/buy-walls-and-sell-walls-you-re-doing-it-wrong
So we're looking for areas where there are stacks of unfilled orders to take a trade from. You can check my previous post about that here: https://steemit.com/cryptocurrency/@technicalanal/the-most-important-technical-analysis-supply-and-demand
There is a big difference in advantages between institutional traders and retail traders. Banks are looking at where there are unfilled orders - they are actually looking at that data - whereas retail traders spend their time looking at charts which is showing the complete opposite.
To summarise the posts I've made before on this:
- Big imbalances in supply/demand levels cause price to rapidly shoot away from an area of accumulation
- We look to those areas to take a trade
- On retesting the level, price should react to the unfilled orders and make a similar move to before
What we also need to consider as important:
- The longer price accumulates at a level, the more orders are eaten up and the level becomes less significant
- Quick retests show a massive imbalance in the order books - this is the ideal scenario to trade
In simple maths:
If we have 1000 buy orders at a level, and 900 sell orders at a level, price is going to spend a lot of time there. When the 900th sell lot is filled, price is free to move.
In another scenario, if we have 1000 buy orders and 50 sell orders, price isn't going to hang around a lot. We have a huge imbalance. This is great for us, because once we revisit, we can expect a big reaction to profit from.
Now, onto some pictures of how we trade these scenarios.
I'll look for 3 areas where I can take a trade from a supply or demand level. Let's look at a supply level.
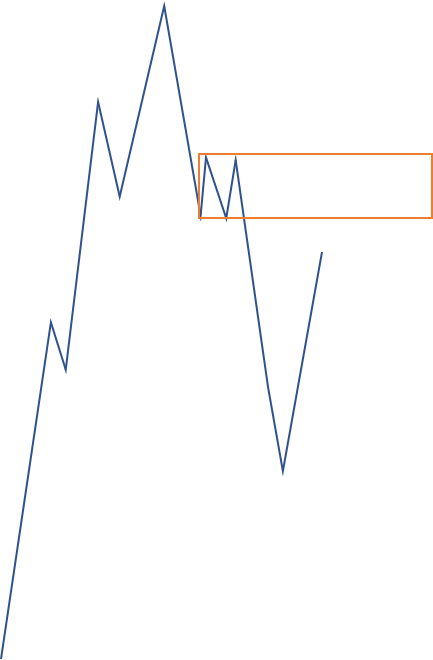
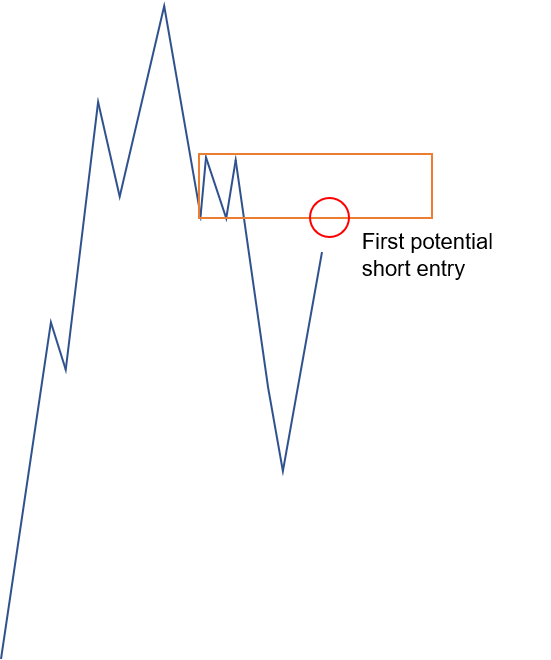
As price approaches, the first level we can look for a trade is the very lower limit of the box, though this is usually the least responsive:
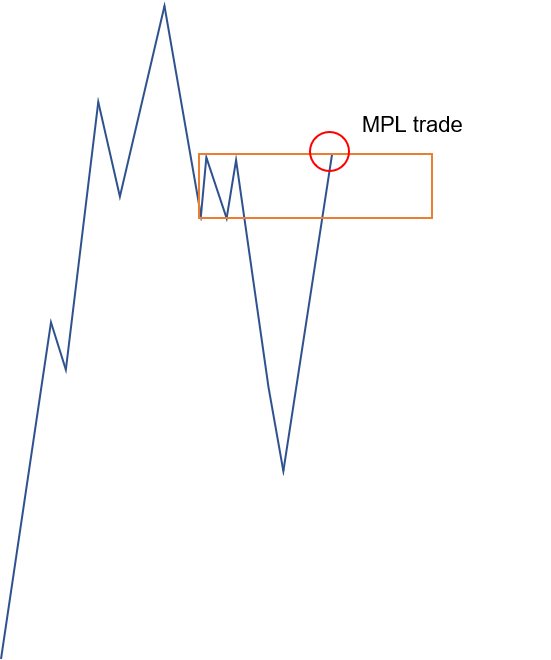
The second and most reliable trade to take is where the bulk of the orders are, at the upper limit of the box, otherwise known as MPL - max pain level. This is where we have a more favourable R:R because we can have a tighter stop loss and a bigger upside.
The entire principle of supply and demand trading seems very basic, but a lot of it comes down to your emotions. Once you look to take your first trade at a level like this, where you expect price to react, your emotions will run extremely high.
Imagine a huge green candle steaming towards your level. What's your first reaction?
You won't expect anything to be able to slow that down, not until you start seeing some low volume candles first. This is the hard part about trading.
It's also harder when you want to wait for an MPL trade and can expect price to turn at any moment in that untested supply or demand level. My third place for entry is if there is confluence with a support or resistance line within the zone.
I've oversimplified the entire strategy, but this is it in its purest form. There are other pieces of the puzzle to consider, most importantly price action upon approach, as well as overall trend.
Thanks for posting this here as well as in the Crypto Trading and Technical Analysis 51% Crew FB Group. Great info!
you're giving away all our secrets dude ! lol
Haha, I wonder how many actually take what I say on board!
dunno, it's probably a round whole number below 1 though
I find it very interesting. Keep 'em coming.
You're quite right about the emotions, I know the theory, but to do it in practise is another matter. I get anxious just reading your example of a green candle racing up towards your sell point! I'm a terrible short term trader, far too emotional.
Indeed. I reckon you can learn some sort of TA and a strategy within 6 months, but the mental side of things could take years. Most won't even get there
I can believe that. I don't even try any more. I now use strategies that play better to my strengths.
I think the mental side is what kills most people, they just can't stand the losing cycles, goes completely against human nature.
It's funny. I can handle the long term hits (my crypto portfolio is dropped to about 25% of its January value), it's just the short term trades that really stress me!
the problem is expectancy. If you have a system that wins 30% of the time but wins really big when it does, that could mean losing money for 8 months in a row and then winning for 3 months (and still be in good profit).
people just can't hack the long losing periods so they give up, or start gambling, breaking all the rules. They just need to tough it out and follow the plan.
Thanks mate, always great content. Learning a lot!
In truth, the charts show us what we don't need to see but As price approaches, the first level we can look for a trade is the very lower limit of the box