Having a look at litecoin (LTC)
Litecoin didn't really have a lot of movement this last few weeks and not a lot of attention.
So lets look at litecoins chart (BTC-LTC).
First lets look at the 1 day candles.
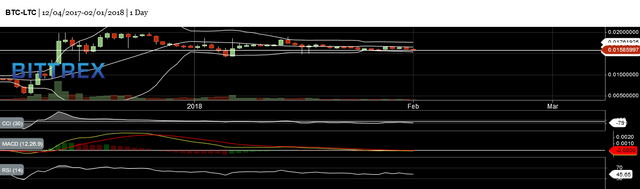
The first thing I notice is again not a lot of movement the last few days just consolidating.
Looking at the RSI it looks if there is still some downwards movement that can happen.
Looking at the MACD the green line is close to the red line and should pass the red line in time, and that would be a good signal of an upwards movement.
Looking at the CCI (commodity channel index) it is sitting in the - area, a good signal to get in.
If you look at the bollinger bands you would see it is below the average and the lines are close to each other , meaning expansion and movement would happen soon.
Now lets look at the 30 min candles
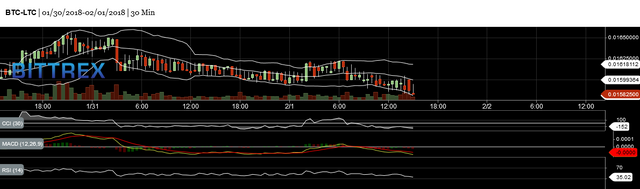
The RSI is at a nice low making it a good entry point.
looking at MACD a good indicator would be when the green line passes above the red line indicating a up trend.
The CCI also indicates it is a good entering point sitting below the -.
Looking at the bollinger bands you should see it is tuching the bottom line witch also indicates an upwards movement.
I am not a financial advisor so still do your own research.
and then... after buying some LTC... it fell on its face lol
SPLAT!
Can you explain to me what you mean by saying that?