Crypto Technical Analysis #1 15-04-2019

Bitcoin (BTC)
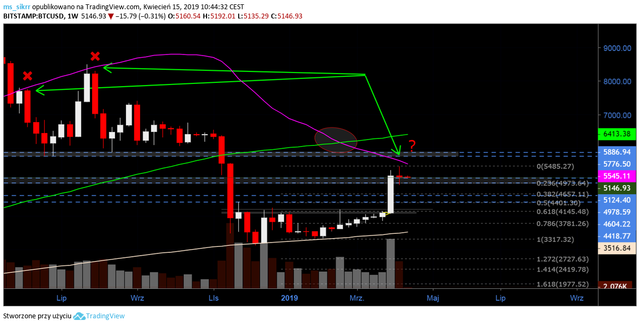
If we look at weekly chart on Bitstamp, last candle showing us that market is undecided and can start correction to testing lower supports. Hovewer it's not yet confirmed. Bitcoin price almost touched SMA 50 last week and it's worth mentioning after crossing this MA last year we had price rejection... twice!
What will happen now? Unfortunately it is too early to answer...

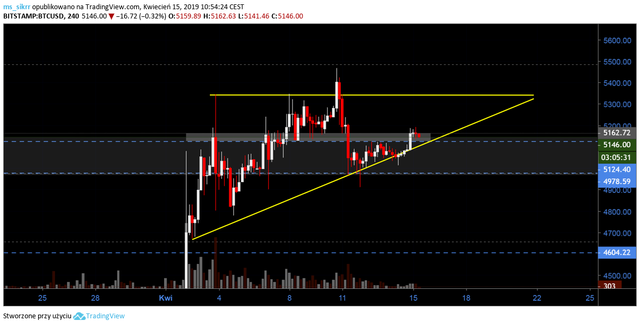
We have very interesting situation on H4 chart: bitcoin price is in ascending triangle again, but this time that formation is much bigger. You can see that lines are drawing in different way than on earlier triangle. If you look at volume - it also shows more bearish than bullish. We should wait for market reaction on support levels.

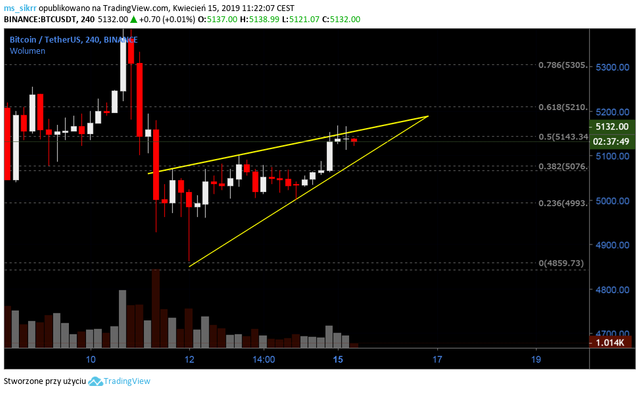
On different exchanges we can see different formations. For example Binance H4 shows us rising wedge with last candles closed under resistance.

What to do now?
We can expect that price will go down, so I suggest to sell 50% of BTC for Tether and try to re-buy at $4800, $4660, $4480, $4200. If price will go up, you can buy altcoins paired with USDT - for example BNB, LTC or NEO

There is a price correction ahead for whale to profit, yes they sell while most speculator is under FOMO. Then again whale will dump a few volume to scare those speculator and sell there holding at lower price. Whale make buy to fill there bag double. Just an opinion and wild guess.