Bitcoin Price Action May Indicate Another Buying Opportunity Is Ahead
I have been watching the price action of Bitcoin the last week or so and am seeing a trading pattern setting up that might have this V bottom retest the old lows.
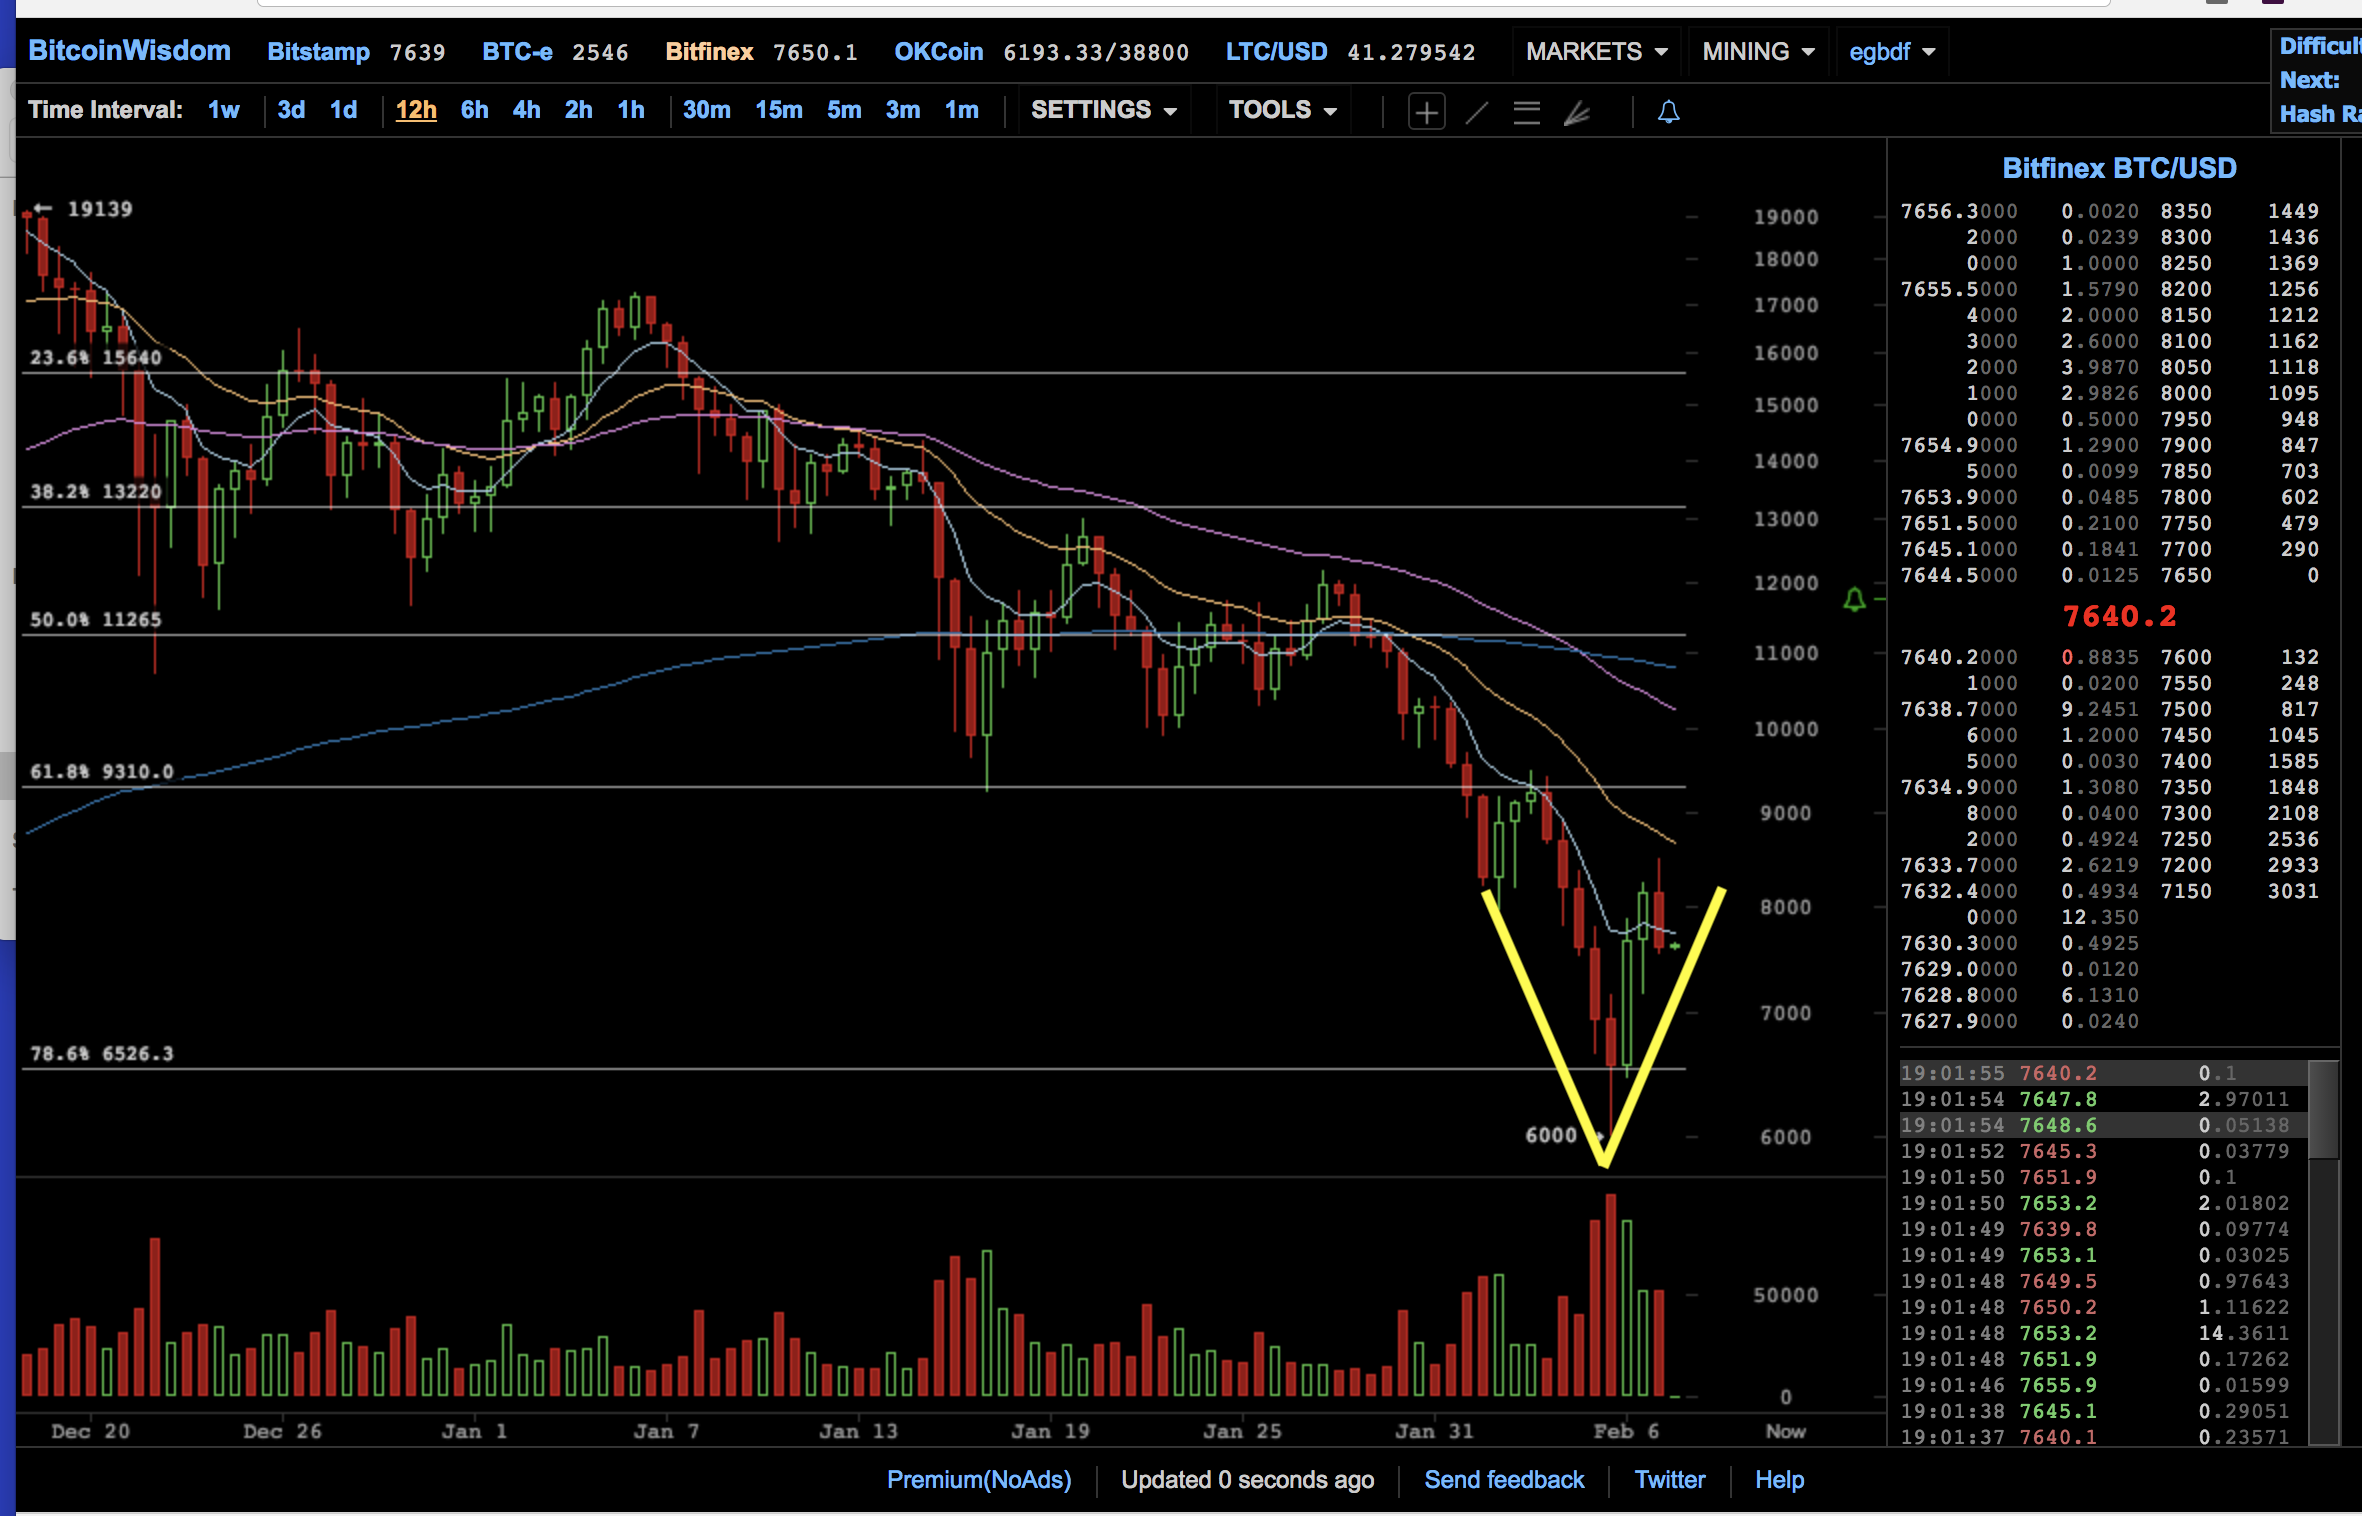
I drew some fibonacci extensions from the low of 2017 back in January and noticed that we dropped in steps that coincide all the way down with this indicator.
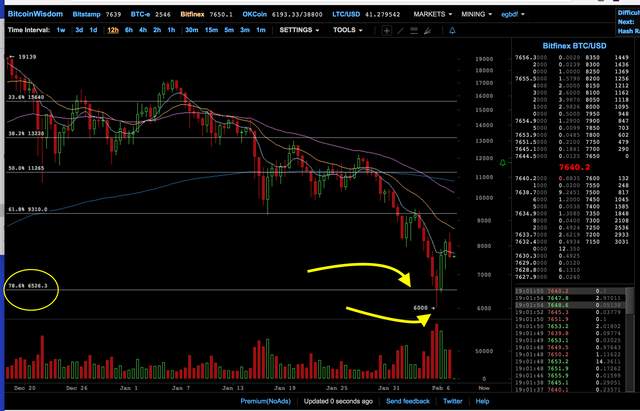
You can begin to see the pattern emerging I am looking at at the 4 hour scale. You can see the moving averages forming a bit of a wedge. This wedge will eventually form the 'heel' of a foot. Right now we are in the 'arch' and are primed to come back down to the old bottom - or close to it - and then flounder around for a while before forming a 'toe'. A little blip up, with one more test of the bottom, and then finally, the real continuation of the loner term up trend.
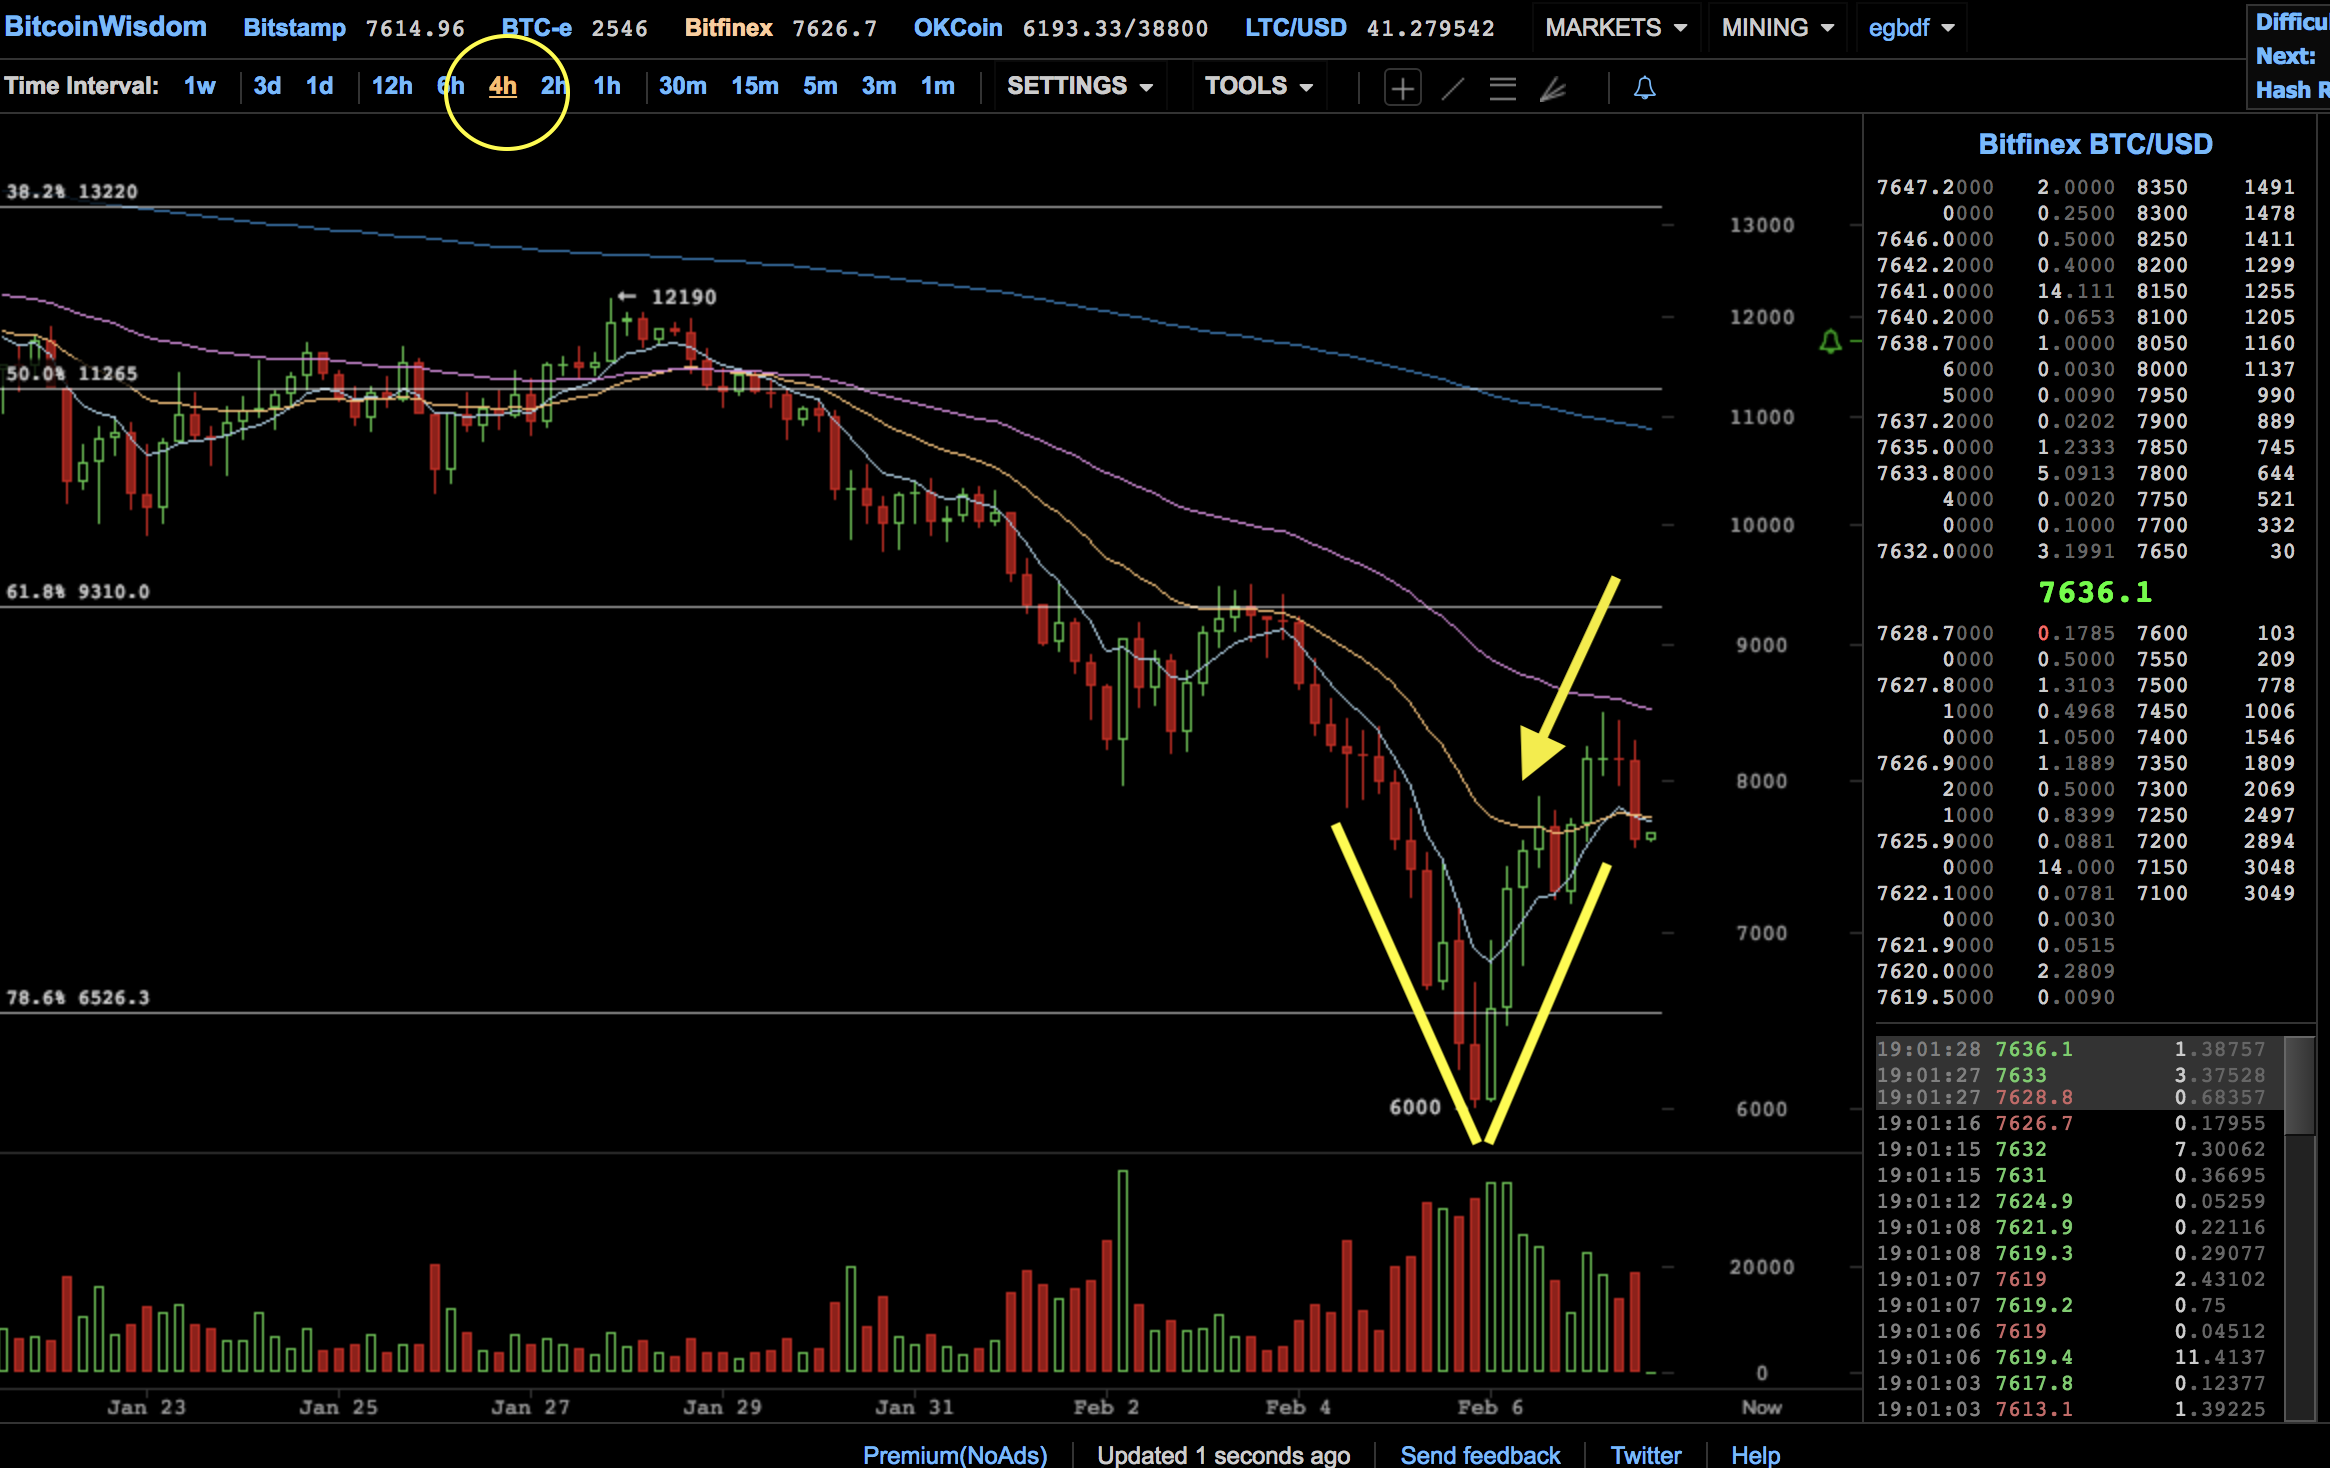
You could see the beginning of the reversal a couple days ago on the one hour chart.
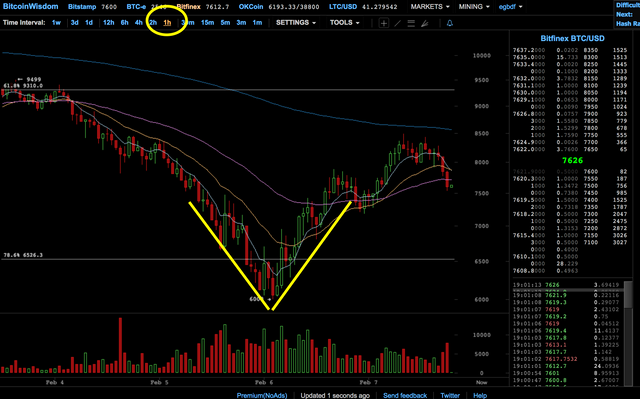
Below is a rough idea of what I am talking about:
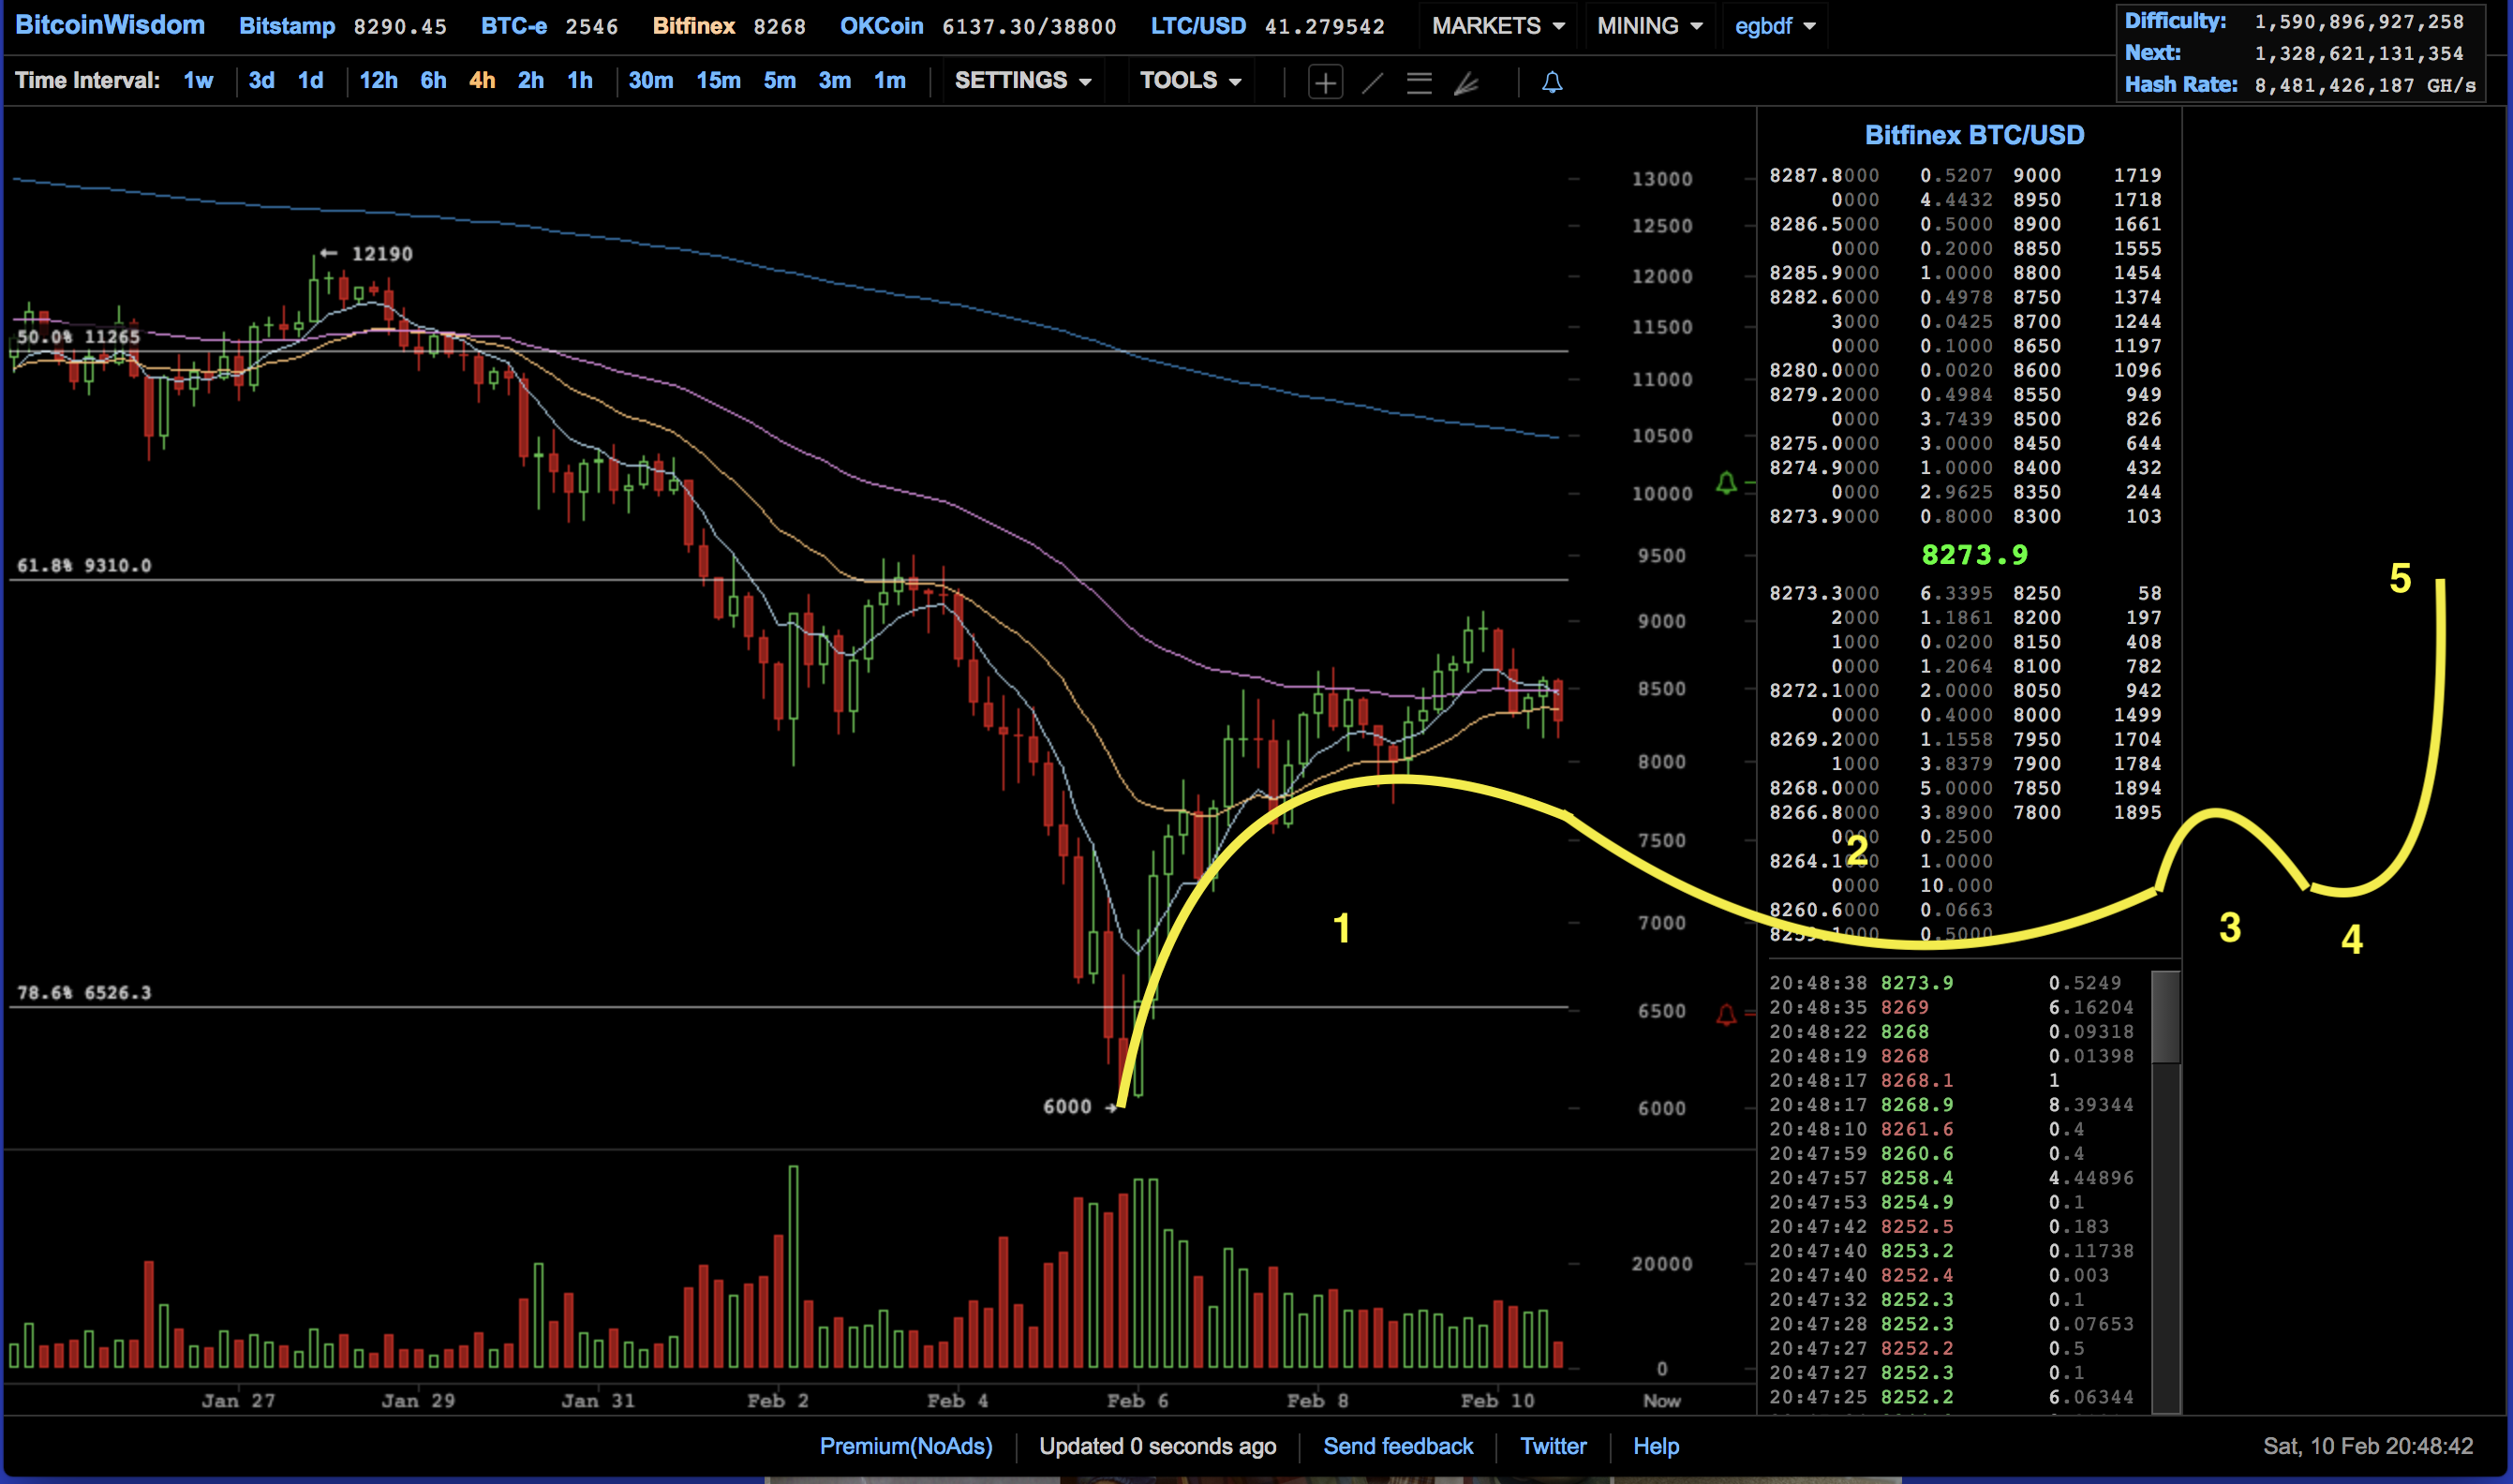
1 is where we are now (heel)
2 is what is immediately ahead of us (arch and foot)
3 is the small spike up and reversal (end of foot and beginning of toe)
4 is the rounded bottom after the mini spike in #4 (toe)
5 where we are going if this theory holds.

__HOWEVER__if we turn south hard and break that last fibonacci - we are in for some SERIOUS PAIN. We will almost certainly test the $5000 level.....
I agree with your assessment. I said in my recent crypto update that we will likely either consolidate sideways for a while then the price would go up, or the price would break down to $5000. There is a chance that it could also form a double bottom at around 6000.
I think we may turn out to be right. We don't seem to be moving up enough to continue in that direction. Im thinking its going to be sideways at best for a while...then a test of the bottom again forming the rest of the W....THEN, most likely another leg up towards the moon (like when the institutions start piling into the market later this year). How about you?