DASH [DASH/USDT] Dash How to Trade

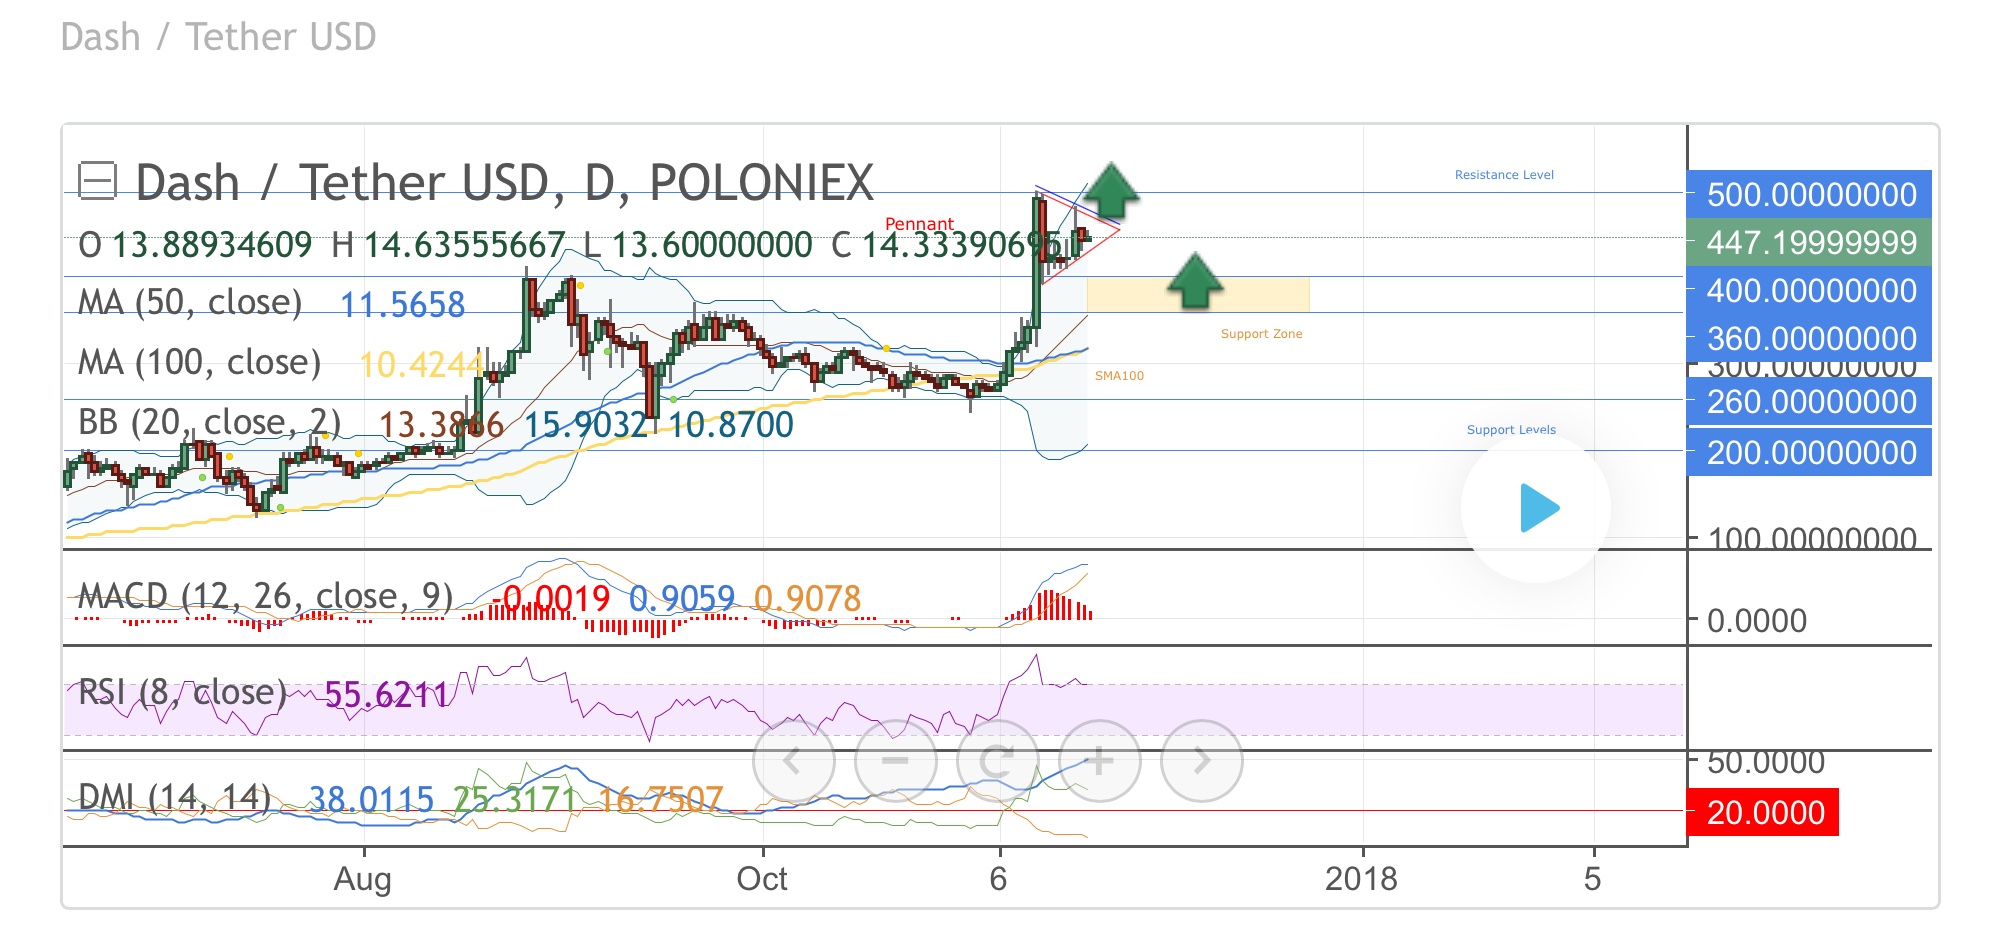
If we look at the daily chart of Dash, we can see a pennant chart pattern. If the price breaks the resistance line of this pattern, it will be realized as a continuation one.
We'll be able to buy based on a breakout signal or place pending orders above 500.00 resistance level . But if we look at 2 important indicators like MACD and DMI, we have to note that their lines climbed on high levels. It tells us about possible correction movement. Also MACD histogram already supports downward movement. If the market breaks the support line of the pennant , we should be ready to see the market falling to the support zone and SMA100. The support zone will be better variant for buying baced on reversal signals.
Comment: The price broke the resistance line of the pennant. It means that this chart pattern is realized as a continuation one. Profit targets should be between 700.00-750.00 level. But if you are not sure that the market can reach these levels, you should fix profit on different levels, starting from the current one.
Congratulations @vinz0380! You have completed some achievement on Steemit and have been rewarded with new badge(s) :
Click on any badge to view your own Board of Honor on SteemitBoard.
For more information about SteemitBoard, click here
If you no longer want to receive notifications, reply to this comment with the word
STOP