Good news of the XRP/BTC trading pair. Stock charts.

Hello, gentlemen..
It looks like the XRP coin has started to have hopes for a trend change.
General schedule. "Binance", timeframe 3 days
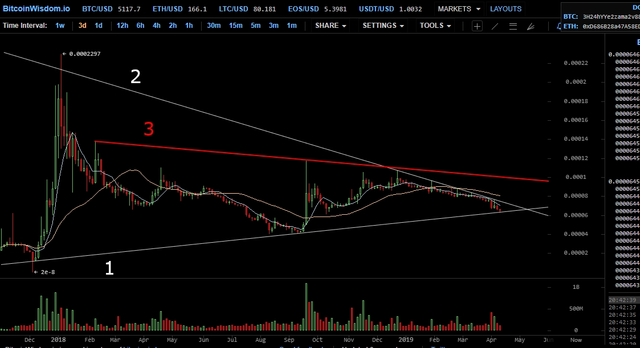
Now that it is clear where the lines came from, look at the enlarged chart with a timeframe of 12 hours.
The token price moved for a long time in a tapering cone, limited by lines 1 and 2. This pattern should close in the coming weeks.
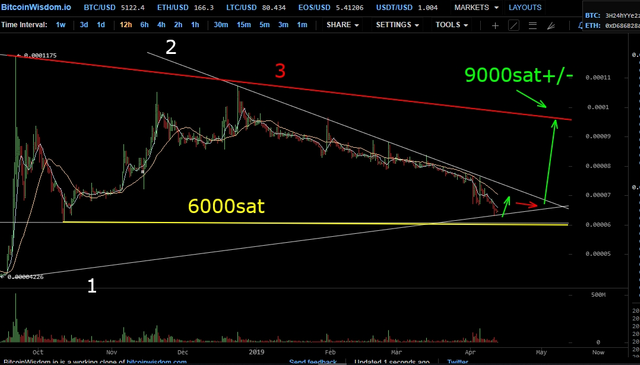
In addition to the support line 1, the chart shows another support line painted in yellow. It is at the level of the previous minimum (6000 sat). In that case, if the price breaks the resistance line 1, then touching the red line, the price will bounce up. After that, the price will again gain a foothold above the line 1
If you believe charts for the rest of the top altcoins in the beginning of may can expect their rapid growth. The same shows and stock chart XRP. At the close of the pattern (1, 2), the price will go up sharply and will be limited in its growth by the next main resistance line 4. This will be level 9000sat. After touching the red line, the price will go down, but the trend will change to positive.
Good luck!
The @upvoteinvest team
A formal disclaimer
Some of the posts might contain our opinion on trading strategies based on our technical and fundamental knowledge. However, please, invest at your own risk. We can’t be held responsible for any losses.