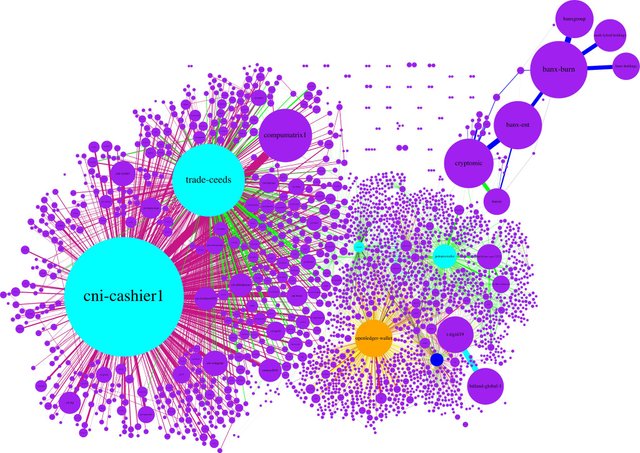
Bitshares transaction graph (past 30 days)
(Improved) Bitshares transaction network graph made from the transactions in the past 30 days.
[ ]
]
Large PNG
Download SVGZ to zoom in to your heart's content
(legend/information below)
My previous bitshares transaction graph had some problems and most of them are fixed in version 2. I switched from using graph-tool only to using graph-tool and graphviz (@xeroc 's recommendation) and improved the following:
- No more overlapping nodes
- Meaningful use of colours
- Using vector graphics
- Filter for UIA's with artificially high prices
I used transactions from the past 30 days as data for the graph, partly because of comments made by @fuunyK in the bitshares telegram group and I wanted to show data supporting or invalidating that statement.
Again... just imagine bitshares without ccedk, open assets and Open Ledger, here and now. Z-E-R-O transactions. The real problem here is the fact that today there is nothing but The Open Ledger conglomerate that add transactions and value to bitshares. I hope for more valuable project and less empty words.
FuunyK
Legend/Explanation:
Data - Transactions from the past 30 days, only transactions with a value of more than $1 are included.
Size of nodes - The total transaction volume on the account (sent+received). The total transaction volume and the size are square root related.
Width of edges - The size of the transaction (square root relationship)
| Minimum amount of transactions | Node color |
|---|---|
| 0 |  |
| 180 |  |
| 360 |  |
| 540 |  |
| 720 |  |
| 900 |  |
| 1080 |  |
| Asset | Edge color |
|---|---|
| COMPUCEEDS |  |
| BANX |  |
| CADASTRAL |  |
| BTS |  |
| BTC |  |
| DGD |  |
| ETH |  |
| LSK |  |
| OBITS |  |
| ICOO |  |
| SOLCERT |  |
| DAO |  |
| STEEM |  |
Note: these colors are for the SVG version of the graph, the colors in the PNG version are a bit different
Have you posted it to bitsharestalk.org? If not I think it's better to post there and link to here.
Thanks for the advice, I made a thread linking to this post: https://bitsharestalk.org/index.php/topic,22609
Impressive!
By the way.. what the hell why the
replylink is changed toTell Your Story?This is a great graph! Thanks for making it. I hear that the bitshares.org website will be updated soon, any chance something like this could be done in real time, for 24hr, 7d, 30d, 1yr blocks (selectable toggle switch)? Regardless, perhaps you can fire up the script and create one for 2017?