Cryptocurrency Code Review: Zilliqa (Zil)
Disclaimer: These reviews are done as is from what is on display in the master branch of the repo’s made available. This review is not a comment on the overall project, scope, or success thereof. This was done as an educational review by me and any comments in the article are simply my opinion. It should not be used as any comment or advice on the project as a whole.
Review Date: 16/03/2018
==EDIT 17/03/2018: Yaoqi Jia (Head of Technology @ Zilliqa) responded to the article, his full comments in the comment section, I have incorporated the relevant statements for the article in quotes, my comments following if any;
- “Local machine tests are quite constrained by the machine’s computing resources, and are thus inaccurate in estimating the throughput of a real blockchain network…” Me: This is why I went for a c5.2xlarge, I figured the 16 gigs should be enough and the 8 vCPU and 31 ECU should give it a good run for money.
- “…the way to measure TPS needs to be on the actual number of transactions processed by the blockchain, rather than those sent to nodes.” Me: The article did not make it clear, but this was the metric used, the second timestamp was triggered by a log watcher when completion of all the transactions occured, so this is how TPS was measured in the article
- “We are preparing testnet for public participation and working on wallets for users to send valid transactions to our testnet in a convenient way.”
- “Due to a different design and different consensus mechanism (pBFT-like in Zilliqa), PoW difficulty isn’t a key factor in determining the throughput in Zilliqa.” Me: so this is why in the article difficulty did not effect the outcome
- “We note the points raised on Ethereum’s scaling solutions in the last section. While, the concept of sharding is easy to understand, it is notoriously difficult to do it right. Ethereum is indeed working hard on their state sharding proposal, but we believe that there are multiple open-research challenges ahead, e.g., overhead of cross-shard communication and data transmission across nodes after reshuffling among others. On the Zilliqa side, we have a working implementation of sharding which we believe gives us a good headstart. While competition is always good for the general health of the ecosystem, there is much more to learn from the successes and failures of both the projects.”
==

Today we look at Zilliqa, the thing that zilliqa attributes to their speed is their sharding implementation. This means they can scale shards horizontally (add more nodes). Quick explanation here, scaling vertically means scaling to use more resources, for example leverage a core cpu instead of a single cpu, or using more RAM, this is vertical scaling, horizontal scaling is adding more machines into a network and having them actually increase throughput. Current blockchains do not scale horizontally because each node is a replicate of the next, with sharding horizontal scaling is possible.
Now Zilliqa’s code base is not small, it looks small, but don’t be fooled;
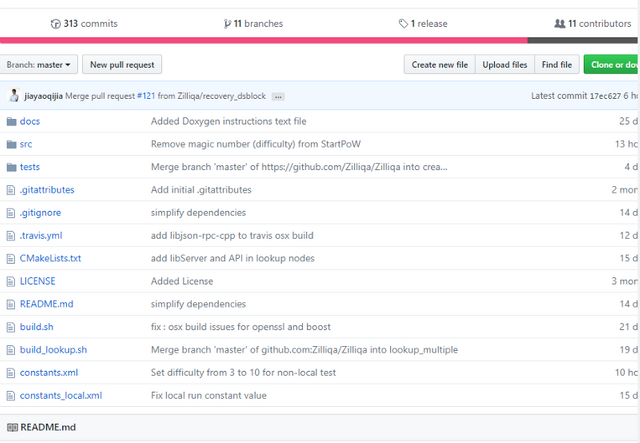
Only 313 commits, but it is a lot of code, so for the sake of this article I decided to go another route, let’s actually run a cluster of Zilliqa nodes. 10 nodes and 1 DS
Zilliqa states minimum requirements as 2 GB ram, let’s test this.

Booted a clean new ubuntu 16.04 LTS with 1 gig ram, tried to run their installation command and had a failure. The fix by the way is easy enough, just run
sudo apt-get update; sudo apt-get install build-essential
If anyone from Zilliqa read this, maybe just add that in as well for a fresh install.
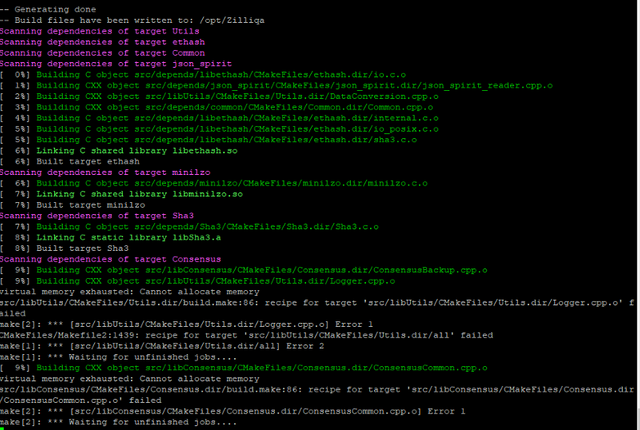
Memory exhausted. Guess they were right, 1 Gig is definitely not enough, booted a 16 Gig machine
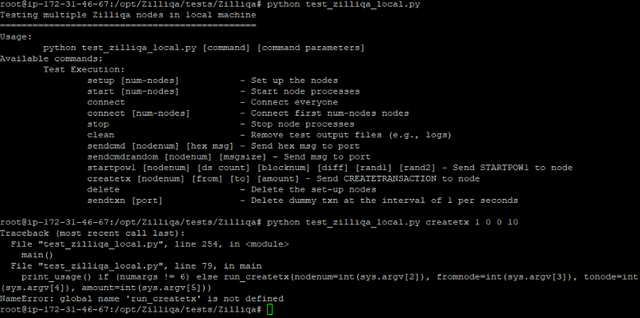
After I had my node set up I wanted to do a transaction tests, unfortunately create transaction isn’t implemented yet, but we have the send transaction option, so not end of the world
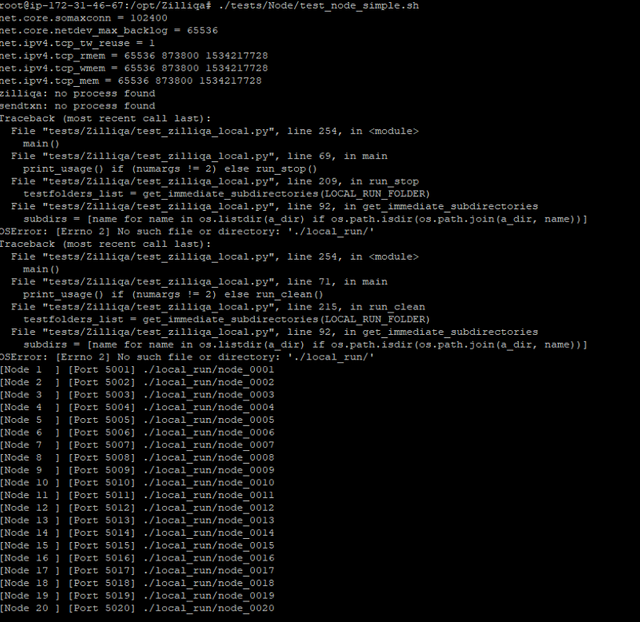
Nodes up and running, we are golden. This was fairly painless in comparison to most, good job so far Zilliqa team.
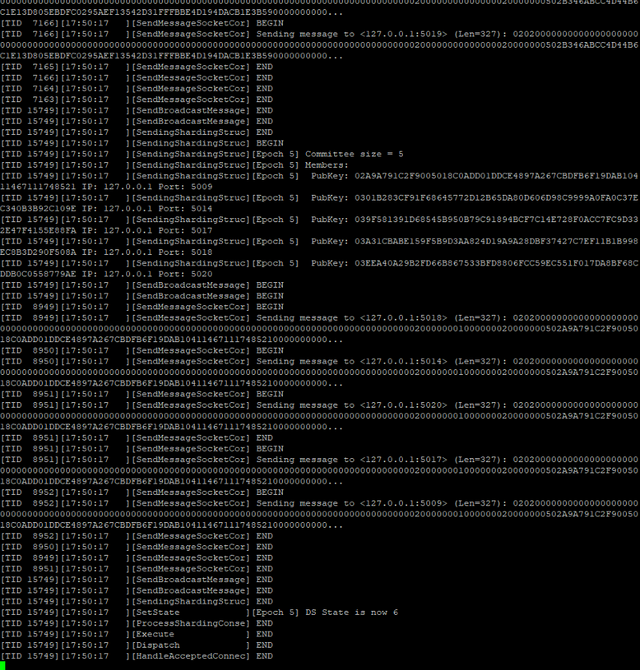
And we are active, so let’s look at that send transaction
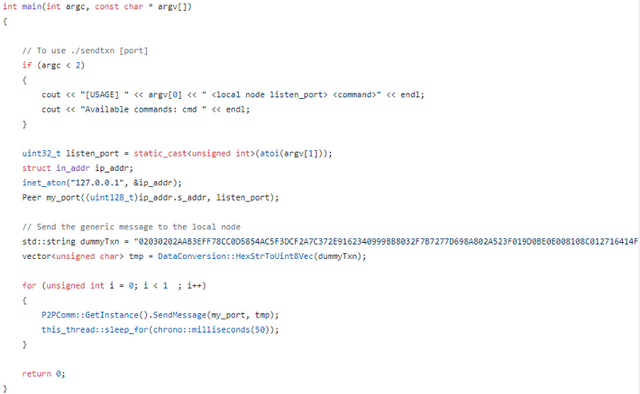
Straight forward enough, send the dummy transaction data to the node of my choice, this is actually perfect since I can use this to run TPS checks, so I set this to 10 000 transactions.

Bad move, 32 minutes later I kill the process, look at that load average above, a load average should never be above 1, we are sitting on 348, my nodes were dying!

Ok, so the 10 nodes might be too much replication, let’s switch to 3 active nodes
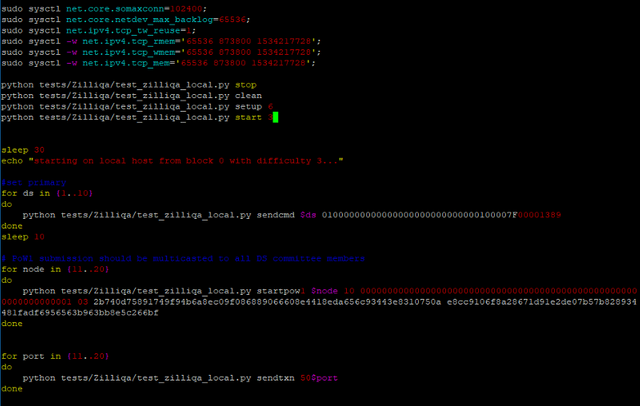
3 nodes changed, and let’s run again, this time a bit more conservative, let’s just do 1000 transactions.

8 minutes later and we kill again. Something isn’t right here

Ok, changed back to 1, and we took 13 seconds. We have a look again at the line calling the transaction, looks straight forward enough, sends the message to the node.

Something is happening here that I don’t quite understand yet, because even though it is sending 1 message, it is not creating 1 message

It’s creating 10 000 messages, no wonder both my x1000 (10 000 000 messages) and my x100 (1000 000 messages) had to be killed.
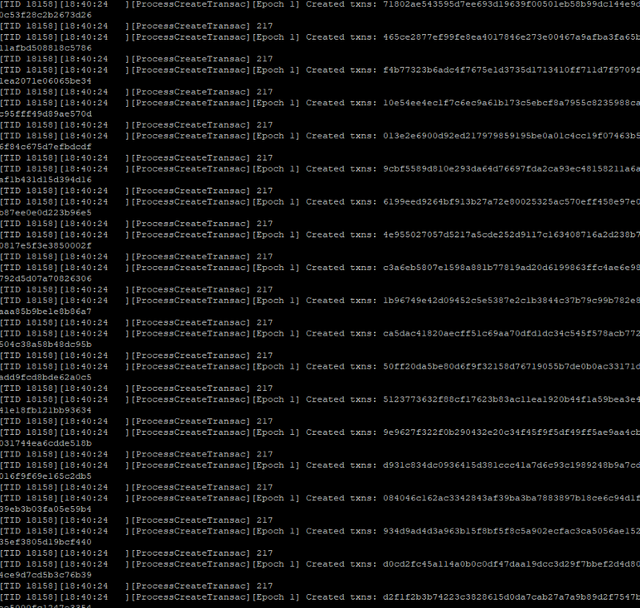
So let’s have a look what is actually going on here;
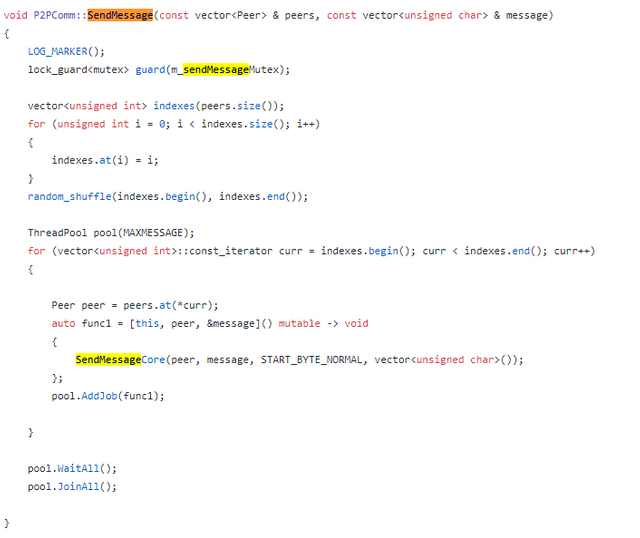
indexes = peers (3) in my latest attempt. A group of jobs are created that will all execute sendMessageCore. Although this should be 3, not 10k.
This is kind of a lot of unnecessary code to just do a random select on a few peers, but I’ll ignore that for now, let’s look at SendMessageCore
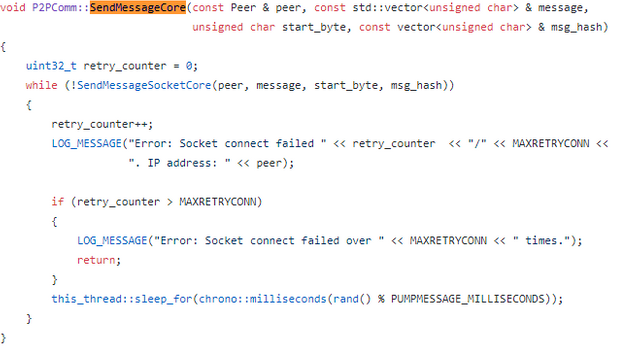
Just another nested loop, now we are looking for SendMessageSocketCore, I’m not a fan of the sleep here, especially not with the random modulus PUMPMESSAGE_MILLISECONDS, but let’s first hunt down SendMessageSocketCore

It’s a long function, so just going to look for the interesting bits

Come on guys, error handling 101, never do a catch all, OOM (Out Of Memory) errors are also going to hit here, even kernel panics, this is very dangerous.
But I don’t see where the 10k transactions are coming from… Nothing in SendMessageSocketCore is inflating them, it’s just standard socket behavior.
Ok, I was looking at the wrong message signature, this is the correct one;

But this doesn’t actually change anything. I ignored my current route of investigation and instead opted for another;
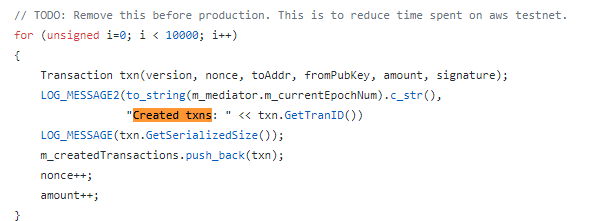
This is our transaction sender, let’s see how it gets called
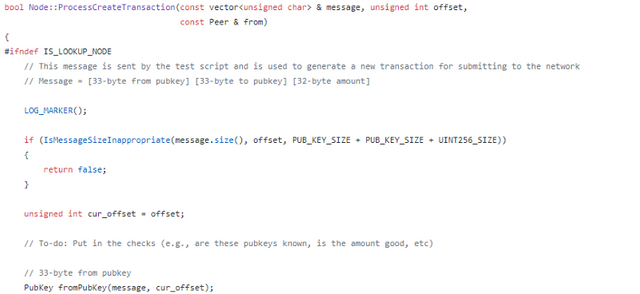
Ok, so this happens for all internal created transactions. No matter what transaction you send, it will be duplicated 10k times by the node as soon as it is sent. A warning or a disclaimer here would be nice Zilliqa team! How was I suppose to know!
But ok, this means 769 TPS per second on a single static node.
This however does mean we can still test bigger transaction numbers (pity I didn’t know this at the start, could have done more conclusive tests then), so a few more 10k tests to set the median

1k TPS

1.4k TPS, 1.25k TPS, 1.25k TPS.
Looks pretty stable between 1k and 1.4k TPS, but now let’s remember these are being generated internally in the code, so don’t get excited just yet. Next we are going to change the loop (to only generate 1 message) and then actually send in 10k transactions, and see the difference.
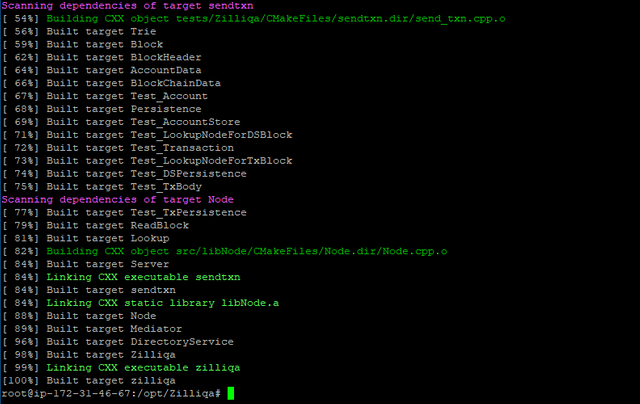
Rebuilt, so let’s run our network test.

200 TPS, that was on 1k messages, let’s try 10k.

312 TPS on 10k, let’s run a few more samples;
270 TPS, 294 TPS.
Ok, so this looks to be about the average TPS we are looking at. But what I want to know now, is what kind of nonce are we using on the difficulty
Using EtHash
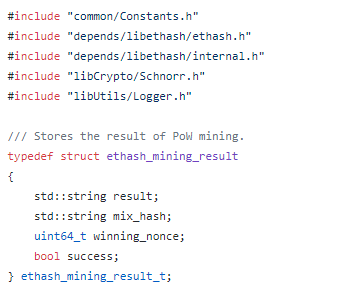
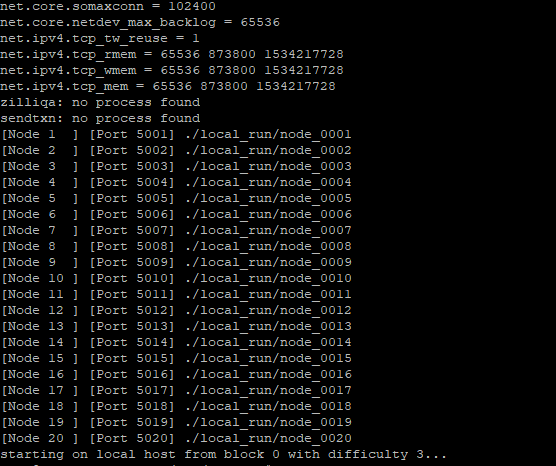
So we know EtHash, and we know we are currently running on a difficulty of 3
What difficulty is Ethereum running?
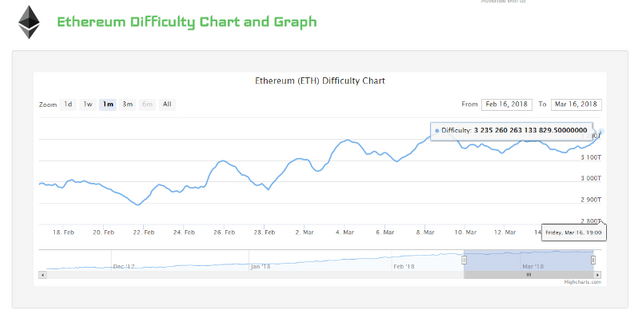
3235260263133829.5 Ethereum difficulty. So, I’m definitely not increasing it to that, let’s increase it to 1000 and check again.
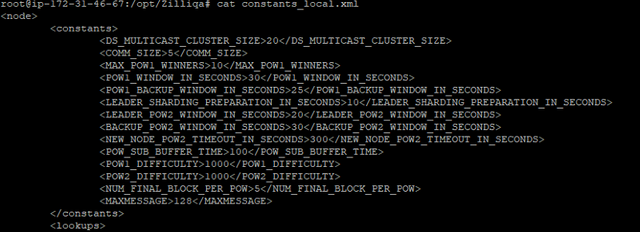
Doesn’t look like it’s going to be that simple, thought the difficulty was taken from constants_local.xml, but this isn’t actually being used.
Guess I was wrong, looks like it’s hardcoded in here, and now to find out which parameter it is.
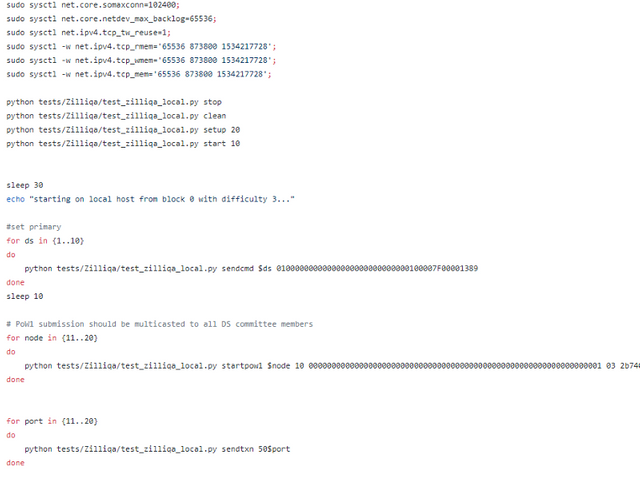
Ok, that wasn’t super annoying, but nodes 1–10 are preconfigured as DS nodes, we need to change that to only node 1 is a DS node and node 2–3 are normal nodes, and this time we will send the transactions to a normal node, not a DS node.
And, that changed absolutely nothing, same TPS, I’m assuming difficulty should not be a normal int. I’ll continue this later, first time for a comparison.
Let’s quickly talk about difficulty, difficulty defines indirectly how long it will take to confirm a single block, the higher the difficulty, the longer the block will take. Ethereum is designed to take 13–15 seconds per block, so as more and more nodes enter the network the difficulty has to increase (to the insane numbers it is at now), Ethereum private (aka a cluster you set up yourself, like my Zilliqa private above), running on a difficulty of 3, can give you around 700 TPS from a few averaged tests. So raw Ethereum is actually slightly faster than Zilliqa currently.
But now we have to talk about the sharding, so at my original 10 shards, and my averaged 250 - 300 TPS, this would mean 2.5k - 3k TPS. This is already true since I can see I can run each nodes transactions in parallel to achieve this. Now to be fair, once the difficulty is increased you would be looking at much lower core TPS, which also means much lower sharded TPS, so in production in a Byzantine environment, we can apply the Ethereum private to Ethereum public 98% core reduction (based on Ethereum metrics), so around 5–6 TPS (currently), sharded to around 50 to 60 TPS on 10 shards.
Conclusion: This is good code, it’s well organized, it’s neatly written, and it shows an above average skillset, it does show a few junior to mid level trends, some of the error handling is reminiscent of developers that don’t have too much production ops experience, but that is something that only comes with much suffering. They have done a good job.
There is a but, Ethereum is implementing sharding and Casper (PoS), when this happens Ethereum throughput will see a potential of 10k TPS, where does that leave Zilliqa? They still have a lot of catching up to do, and I worry they won’t have the capacity to do it.
They have however built an impressive system up to here, not a production ready system yet, but a good system none the less, so I’m excited to see what future releases will bring.