10-Year Rates May Climb To As High As 2% As Risk-Taking Returns
This post was written exclusively for Investing.com
The risk appetite among investors appears to be on the rise and that means yields may be on their way higher. Equity markets are climbing following the recent coronavirus led sell-off. Markets in Asia, North America, and Europe have rebounded sharply, and in some cases, to record highs.
Sector rotation in the S&P 500 suggests that investors are once again moving into the riskier parts of the equity market. But it isn’t just equity markets that are seeing a bounce: essential global growth commodities such as copper and oil appear to be stabilizing and even creating technical reversal patterns, suggesting they may begin to increase in price. As investors start to move back into risk assets, one would think that yields on the 10-year Treasury would start to rise once again.
S&P 500 Price Chart  S&P 500 Price Chart
Yields May Be on The Rise
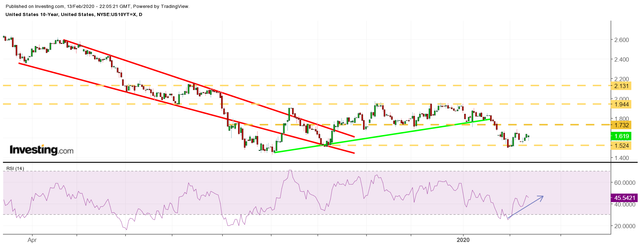
Yields on the 10-year Treasury have declined to their lowest levels since early October as fears of the rapidly spreading coronavirus caused investors to sell risk assets and move into safe havens. However, the risk aversion trade appears to be slowly unwinding, and that should result in yields on the 10-year starting to risie once again.
The yield on the 10-year reached roughly 1.5%, where it found a healthy level of technical support in early February. Since that time, the rate has bounced back to approximately 1.62% as of Feb. 13. Another sign that yields may climb is found in the relative strength index which reached oversold levels below and is now trending higher. The pattern would suggest that rates will rise back to resistance at a level of around 1.75%, while potentially signaling an even longer-term move higher to 1.95%.
U.S. 10-year  U.S. 10-year
Equity Markets Are Racing Higher
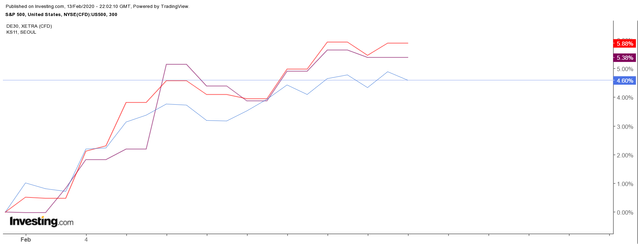
The most obvious sign that the risk appetite of investors is shifting is the move in equity markets. Since Jan. 31, the markets around the world have been ripping higher, with the South Korea KOSPI rising by roughly 6%, while Germany has increased by almost 5.4% to a record high, and the S&P 500 has increased by almost 4.6%, also to a record high.
Sector Rotation
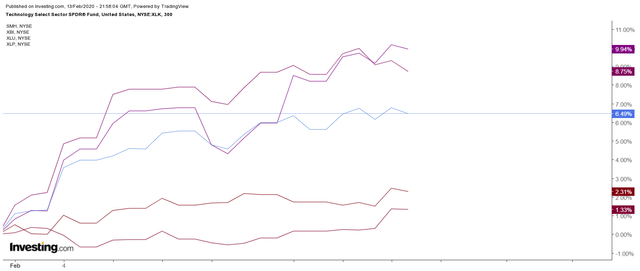
Sector rotation within the U.S. markets shows that the Van
Eck Vectors Semiconductor ETF (NYSE:SMH) has increased by over 10% in February alone. That has been followed by the SPDR S&P Biotech ETF (NYSE:XBI) which has jumped by almost 9%, and the Technology Select Sector SPDR ETF (NYSE:XLK) rise of 6.5%. Meanwhile, the two worse performing sectors have been the risk aversion groups, the Utilities SPDR ETF (NYSE:XLU) and Consumer Staples Select Sectors SPDR ETF (NYSE:XLP).
Sector Rotation  Sector Rotation
Commodities Climb
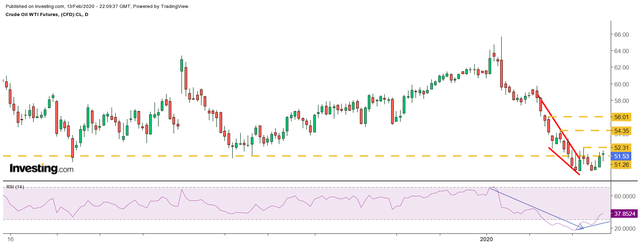
Even more impressive is that we are seeing commodities such as oil and copper begin to put in a bottom and are forming patterns that suggest significant reversals maybe on the way. For example, oil has formed a bullish reversal pattern known as a falling wedge. The commodity has already broken out of the falling wedge pattern, suggesting that oil prices may head higher from their current levels, perhaps to as high as $56.
WTI Futures  WTI Futures
If the market has moved from a risk-off to risk-on sentiment as the equity market rally, sector rotation and rising commodity prices would seem to suggest, then it seems fair to believe that yields have only one way to move from current levels, and that is higher. That may be especially true if the latest run of better than expected economic data continues.