U.S. 10-Year T-Bill At 60-Year Low As Equity Markets Correct
I last wrote about U.S. 10-year Treasury yields in a post back in August 2019, which warned of potential upcoming weakness in the equity market. Back then it was trading at 1.556.
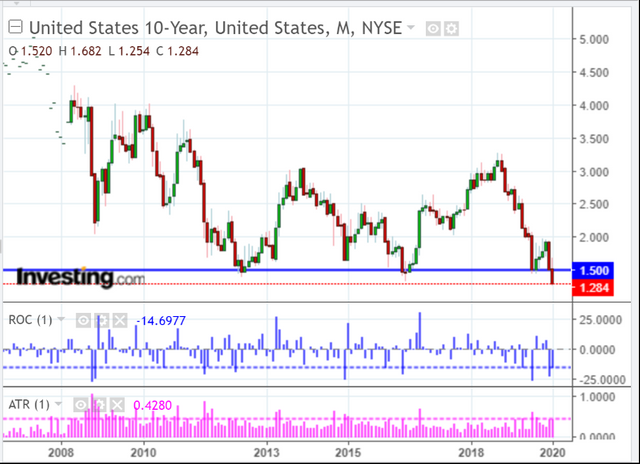
Since then, it rose to a high of 1.952 in December, reversed course sharply in January before plunging to an all-time new low of 1.254 as of 2:15 pm ET on Thursday, as shown on the Monthly chart below. All this while equity markets reached a 10% correction level Thursday morning.
The big question: is this capitulation or is it a warning of further equity weakness?
I've shown the Rate-of-Change (ROC) and Average True Range (ATR) indicators in histogram format and with an input value of one period to highlight extreme movements in both directions.
Inasmuch as neither one is at an extreme level yet, we may see a further drop in the U.S.10-YT, as well as equities. If it fails to recapture and hold above 1.50 sometime soon, equities are in for more volatility in both directions.
Monthly 10-Year U.S. Treasury Bill  Monthly 10-Year U.S. Treasury Bill