Treasury Market Flashes New Warning As Real Yields Go Negative
It happened before, in 2012-2013, but the US economy muddled through a soft patch. Is it different this time? It’s a question worth pondering as the global economy struggles to model the spreading coronavirus that’s weighing on China and, increasingly, reverberating in economies around the world. The European Commission today, for example, advises that coronavirus is a “key downside risk” for the bloc’s economy.
The Treasury market appears to be pricing in this risk. Notably, real yields for key maturities in inflation-indexed government bonds (TIPS) have slipped into negative terrain lately. From a big-picture perspective, real yields (compensation for holding bonds after adjusting for inflation) tend to be positive and rising in periods when the economic outlook is positive and expansion is accelerating. By contrast, negative yields imply the opposite.
The real yield for TIPS, however, is complicated by the fact that the Treasury market overall attracts global demand and so it’s unclear how reliable US government bond rates are these days for assessing the outlook for the American economy. There’s also a debate about how useful TIPS are for macro analysis since this corner of the Treasury market is considerably less liquid vs. its nominal counterpart for government bonds.
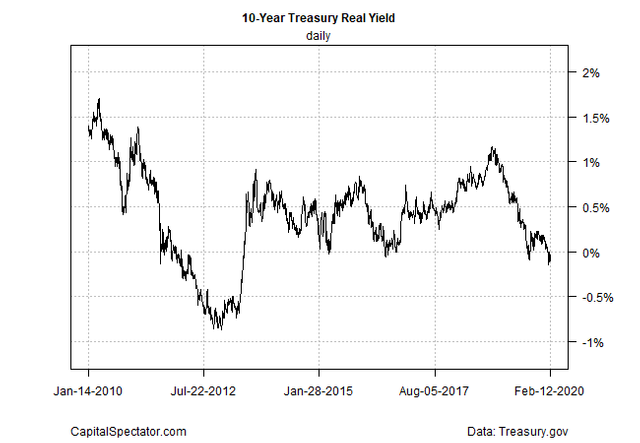
What is clear is that TIPS yields have been sliding for more than a year and has recently dipped below zero for key maturities. As of yesterday’s close (Feb. 12), the 5- and 10-year TIPS maturities were yielding -0.19% and -0.04%, respectively, according to Treasury.gov. The 5-year yield has been negative throughout 2020 to date; the 10-year maturity is a relative newcomer to the sub-zero pricing, but so far in February it’s been a consistent trend.
It comes as no surprise to learn that the 10-year TIPS rate is plumbing depths below zero. As the chart below reminds, the slide for this maturity’s real yield has been unfolding for well over a year. If trend is fate for the near-term, the current environment has been foreordained for months.
10 Yr Treasury Real Yield Daily Chart  10 Yr Treasury Real Yield Daily Chart
The economic implications are less-than-encouraging, or so one can argue. Indeed, last September, when the 10-year real yield was sliding but still positive, just barely, one analyst worried about the inferred forecast. “Real yields have just cratered and the pace of the decline is troubling,” Subadra Rajappa, head of US rates strategy at Societe Generale (PA:SOGN), told Bloomberg five months ago. “And with inflation expectations also falling, it shows the market is starting to price in a meaningful economic slowdown that will warrant a much more prolonged period of Fed rate cuts than just the mid-cycle easing the Fed had envisioned.”
Now that TIPS yields are consistently negative, it’s fair to say the outlook has deteriorated from a real-yield perspective.
The good news is that the US economy has remained resilient, at least relative to some of the darker expectations. GDP growth in the recently reported fourth-quarter data for 2019 shows that output was steady with a moderate 2.1% gain, matching Q3’s pace.
Some nowcasts for this year’s Q1 point to a stronger trend. The Atlanta Fed’s GDPNow model, for instance, is looking for an uptick to +2.7% (as of the Feb. 7 estimate). Of course, you can also point to weaker nowcasts: the New York Fed’s current estimate is considerably weaker, projecting a deceleration to +1.7% (Feb. 7).
Perhaps the critical variable to watch is how the coronavirus risk unfolds in the weeks ahead. At the moment, the news has taken a turn for the worse. China has just reported a record rise in deaths and a large jump in the number of infections, which suggests the challenge is bigger than previously estimated.
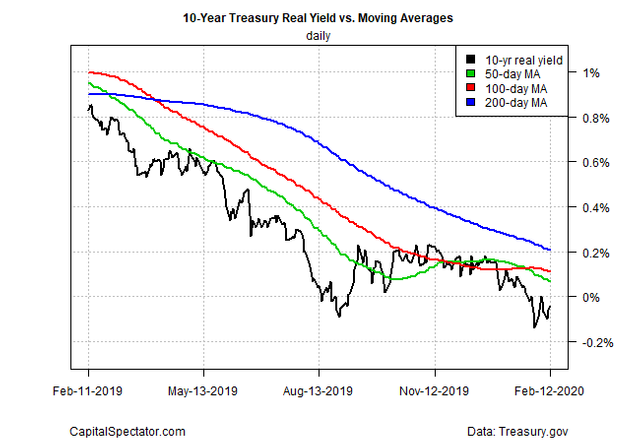
As for the 10-year TIPS yield, the near-term outlook points to an ongoing negative real yield, which appears poised to slip further into sub-zero levels, based on projections via a set of moving averages.
10 Yr Treasury Real Yield Vs Moving Averages Daily Chart  10 Yr Treasury Real Yield Vs Moving Averages Daily Chart
The implications for the global economy are still uncertain and evolving, and for now the US appears relatively insulated. But there will be blowback, albeit in varying degrees for different countries. The draconian quarantine in China to fight the virus is slowing that country’s economy, which is reverberating in supply chains around the world.
“The quarantines and other compulsory measures aimed at containing the disease are severely handicapping the Chinese economy, with knock-on effects elsewhere in Asia,” writes Akira Kawamoto, a former deputy director general in Japan’s Ministry of Economy and a professor at Keio University. “These shutdowns constitute a major shock to global companies’ supply chains across Asia.”
How severe this blowback will be beyond Asia remains unclear. Assuming it’s zero, however, is almost certainly wrong. Until the outlook becomes clearer, the real yield for TIPS appears set to slip further.
Hi! I am a robot. I just upvoted you! I found similar content that readers might be interested in:
http://www.capitalspectator.com/treasury-market-flashes-new-warning-as-real-yields-go-negative/
this is a useful info i would not want to ignore..
Posted via Steemleo