US Bonds Roar Out Of The Gate In 2020
The new year is not quite a month old but that hasn’t stopped US bonds from piling up impressive returns. For the strongest corners of fixed income, it’s fair to say that 2020 has been spectacular so far, based on a set of exchange-traded funds.
Leading the field by a wide margin year to date: long Treasuries. The i
Shares 20+ Year Treasury Bond (NASDAQ:TLT) has surged 6.7% this month through yesterday’s close (Jan. 29). Long bond prices have been boosted by a renewed risk-off appetite in recent weeks, in part due to global concerns over the spreading coronavirus.
It doesn’t hurt that the Federal Reserve yesterday signaled no plans to raise interest rates any time soon. “Uncertainties about the outlook remain, including those posed by the new coronavirus,” Powell explained at a news conference yesterday. “There is likely to be some disruption to activity in China and globally” from the virus.
TLT’s rise this year is striking in absolute terms, but it’s even more impressive on a relative basis. TLT’s year-to-date gain is more than triple the 1.7% rise for the US investment-grade benchmark via Vanguard Total Bond Market (BND). Adding to TLT’s shine this year, the fund is also outperforming the US stock market by a hefty degree – US equities are currently up a relatively modest 1.5% year to date, based on SPDR S&P 500 (SPY (NYSE:SPY)).
The only case of year-to-date red ink for the main slices of US fixed income at the moment is in junk bonds: SPDR Bloomberg Barclays (LON:BARC) High Yield Bond (JNK) is down fractionally so far in 2020, slipping 0.1%.
US Bonds ETF Performance 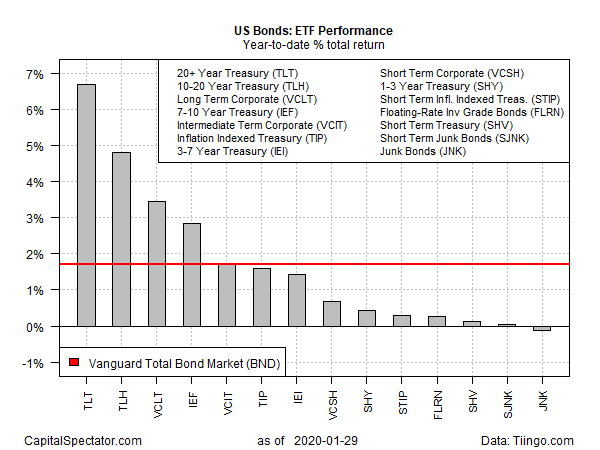 US Bonds ETF Performance
Another factor that’s driving bond prices higher is a revival in recession worries. Although there are no signs that a downturn is imminent (as last week’s business-cycle profile indicates), the Treasury market is inclined once more to price in a higher probability of weaker or negative growth. The 10-year/3-month spread, for instance, fell to 4 basis points yesterday, the lowest since October. An inverted yield curve, in other words, looks increasingly likely in the days ahead.
YC3
MO Yield Curve Daily Chart 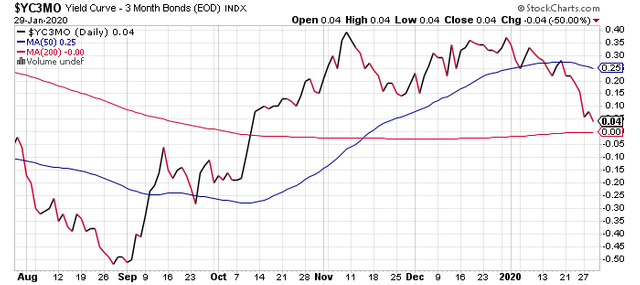 YC3
YC3
MO Yield Curve Daily Chart“The flattening of the curve is an indication that the growth concerns are greater now,” says Marvin Loh, senior global macro strategist for State Street (NYSE:STT). “Everything is just a bit more fragile, and we’re all wondering what the next headline is around the coronavirus.”
Today’s first look at fourth-quarter GDP for the US, however, is expected to post another moderate gain. Econoday.com’s consensus point forecast is 2.1%, matching Q3’s gain. A 2.1% increase in Q4 output is also the median estimate based on a set of nowcasts compiled by The Capital Spectator.
Meantime, the Fed seems to be telling markets that it’ll keep interest rates steady even if growth endures but if the economy weakens a new round of stimulus will unfold.
“While the Fed may want to portray its 2020 rate policy as stable, markets are signaling that their bias should be to further easing,” wrote Nicholas Colas of Data
Trek Research in a research note on Wednesday.
In any case, bullish momentum in the bond market overall is strong, based on two sets of moving averages. The first compares the 10-day moving average with its 100-day counterpart — a proxy for short-term trending behavior (red line in chart below). A second set of moving averages (50 and 200 days) represent an intermediate measure of the trend (blue line). As of yesterday’s close, all the fixed-income ETFs listed above are trending positive. The future’s still uncertain, but for now the crowd is pricing in favorable winds for bond prices in the near term.
BND Wealth Index Vs Percentage Of Bond Funds Trending Up 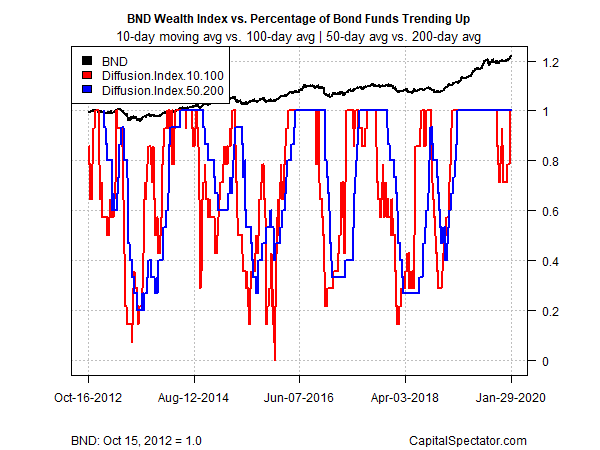 BND Wealth Index Vs Percentage Of Bond Funds Trending Up