REITs And Bonds Rose Last Weeks As Global Stocks Fell
Coronavirus-related selling took a toll on equity markets last week (and more of the same is in store for today). But in a striking bit of defiance, US real estate investment trusts (REITs) bucked the trend last week, posting the strongest gain for the major asset classes for trading through Friday, Mar. 6, based on a set of ETFs.
Vanguard Real Estate (NYSE:VNQ) rallied 3.8% for the trading week. The gain followed a steep loss in the previous week and so some (all?) of last week’s gain was linked to a bounce that often emerges after sharp declines.
Bonds in various forms were also gainers last week. The strongest fixed-income increase was in foreign-developed-market government bonds: SPDR Bloomberg Barclays International Treasury (NYSE:BWX) posted a strong 2.7% advance.
The biggest loss for the major asset classes: broadly defined commodities, which tumbled 4.0%, based on i
Shares S&P GSCI Commodity-Indexed Trust (NYSE:GSG).
US stocks managed to eke out a small gain, despite a wild trading week. Vanguard Total US Stock Market (NYSE:VTI) edged up 0.1%–the fund’s first weekly advance in three weeks.
The Global Market Index (GMI.F) also ticked higher last week. This unmanaged benchmark that holds all the major asset classes (except cash) in market-value weights added 0.5%.
ETF Performance Weekly Returns Chart 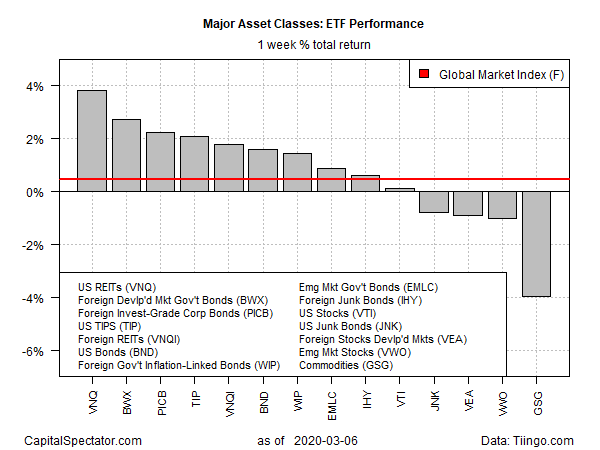 ETF Performance Weekly Returns Chart
The recent declines in most markets around the world have pared one-year results, but for the moment this time window continues to enjoy solid, widespread gains. The leader at last week’s close: US investment-grade bonds via Vanguard Total Bond Market (NYSE:BND), which is ahead by a strong 13.4% total return over the trailing 12 months.
The deepest one-year loss: broadly defined commodities via GSG, which is off with a deep 17.8% decline.
GMI.F’s double-digit one-year gains of recent vintage has faded to single-digits, but the current one-year 7.4% total return is still a solid performance relative to the benchmark’s history.
ETF Performance Yearly Returns Chart 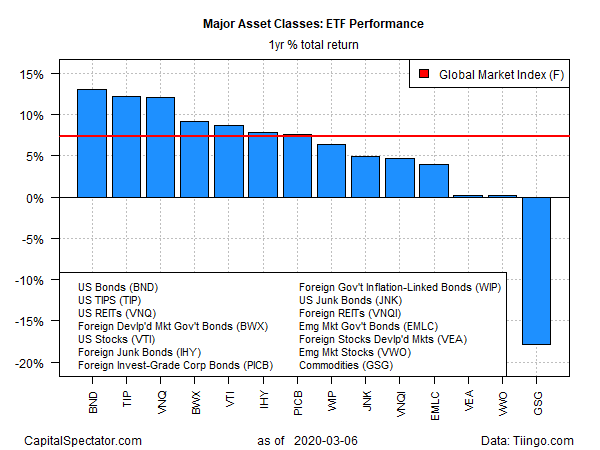 ETF Performance Yearly Returns Chart
Profiling momentum for the ETFs listed above shows a sharp deterioration for the short-term metric, based on the 10-day moving average relative to its 100-day counterpart. For the first time in over a year, less than 50% of the funds representing the major asset classes are posting a positive short-term trend. This weakness has yet to show up in the longer-term profile (50-day average vs. 200-day average), but given the renewed selling today (Mon., Mar. 9) it’s likely that the trend data will continue to stumble.
Diffusion Index 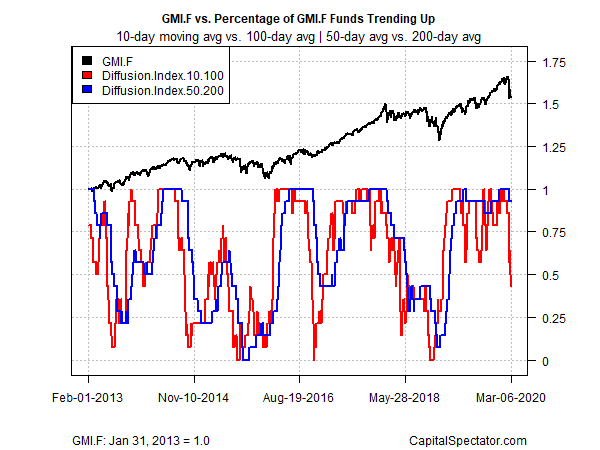 Diffusion Index
Hi! I am a robot. I just upvoted you! I found similar content that readers might be interested in:
http://www.capitalspectator.com/reits-and-bonds-rose-last-weeks-as-global-stocks-fell/