Cryptocurrency market in a nutshell
In this today’s market report, we will use technical analysis to asses the state of the market in its entirety. We will compare several charts including altcoin market cap, Bitcoin dominance and DAI to forecast price and direction of BTC and possibly direction of altcoin market. You might be wondering why we have decided to compare all these parameters together. If yes, follow through the entire analysis, and we will piece by piece paint you the picture of how these components interact with each other on the technical level. Technical analysis reflects behavior and emotions of the market. Important correlations of different investments instruments that relate to one another can therefore provide a perfect tool to asses participants emotions towards them.
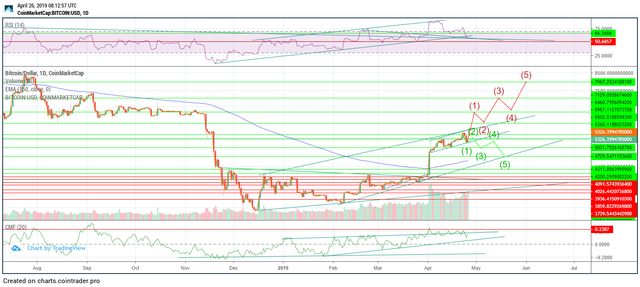
Let’s first start with the assessment of Bitcoin, and particularly with relation of RSI and price. In the picture below, if you look first at daily RSI, you can see that the trend line that had worked as a support three times already, has been broken. That would at first imply a fall in price. The price of Bitcoin has though managed to stay above the bottom of the falling wedge price pattern, and that gives uncertainty to the further direction. This uncertainty is enhanced by the bounce from the long-term RSI resistance. Usually, the resistance once broken turns into a future support. That adds suspicion to the bearish scenario. Last thing to notice in this picture is the volume profile. First high in price was followed by a substantial gain in volume. The second one has so far not been able to reach this volume, which suggests that if the bounce is not strong enough, the bearish scenario could still crystalize. Our goal now will be therefore to decide if this is just a bearish fake out, or if this is a sign that there is a storm ahead of us. After analyzing the Bitcoin price by itself, the chances that there will be further price hike or fall are currently equal. Let’s see what we can gather further by the weight of evidence approach and let’s see how the chances change when we consider other components.
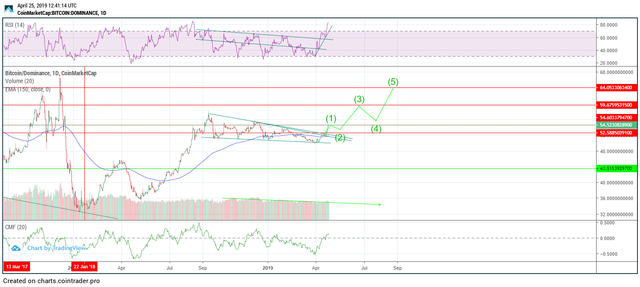
To have a better picture of what is going to happen, let us look at Bitcoin dominance and later compare it to the Bitcoin price. From the picture, it’s obvious that Bitcoin’s trend of raising dominance has decided to continue. To do so though, the first resistance at which dominance currently dwells has to be penetrated. If we look at the RSI, it’s possible to see that the dominance is “overbought”. The concept of overbought in this instance is rather signal of exagorated positive emotions on the shorter time frame. That suggests a short term correction that could be followed by a hike reaching final long term target measured by the height of the falling wedge pattern from which the dominance broke out. To find out if this is not just a fake out, we will later look at the altcoin market cap to see if altcoins are in the good position to be bought, or if investors already began abandoning altcoins for BTC to save themselves from further losses. As of now, let’s compare Bitcoin’s dominance with Bitcoin’s price. By assesing how these two indices moved again each other in the past, we should be able to find out if this is just a fake out or a true break out.
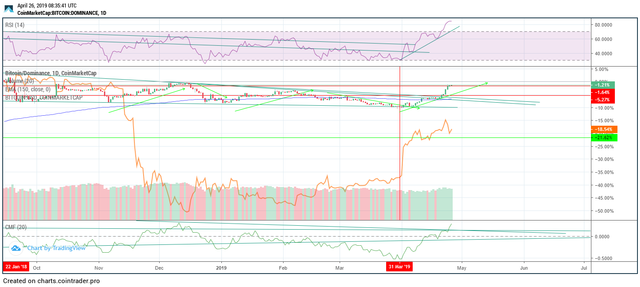
We have used green arrows for you to notice that climb in the Bitcoin’s dominance has been generally followed by the fall in Bitcoin’s price. That has held true for the entire period of the falling wedge pattern in the Bitcoin dominance. Then, suddenly, as dominance bounced from the support of the pattern, Bitcoin’s price literally shot up. You can notice the point by the red vertical line. That is unlike normally in the past, therefore this change in the trend could serve as a confirmation of the long-term bullish trend change in the Bitcoin dominance, and possibly price as well. In the immediate future, Bitcoin dominance could though retrace and that would imply that price as well could be affected in the short term. Next on the list will be altcoin market cap to decide if investors already keep selling altcoins for BTC.
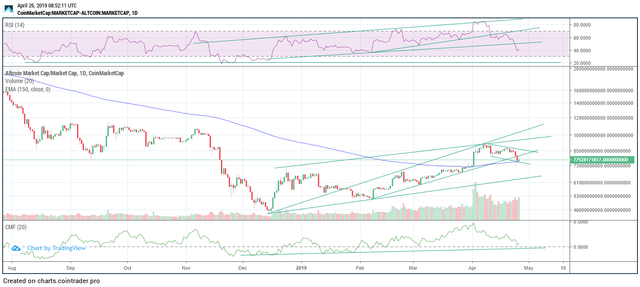
If they do so, there are two scenarios that could crystalize. Bitcoin could either recover and keep on rising, or investors can be running away from altcoins back to the Bitcoin with some of them selling for fiat and pushing the Bitcoin’s price further down. Let’s therefore start with the analysis and try to find out which one of these is more likely. Starting with RSI, we can notice that all the past trendline supports have been decisively broken except the last one. Volume as well keeps on rising as the price plummets and declines when it recovers. That suggests a further fall in the altcoin market cap in the long term, and possible short-term bounce from the 150-day MA. Once that one becomes decisively penetrated, it’s very likely that many altcoins will suffer a big fall. If not and upcoming bounce is on the high volume, the opposite could happen, and altcoins could surge. That is though from the analysis as of now less likely.
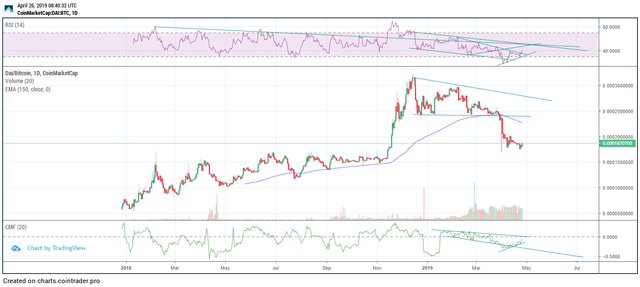
The most possible scenario right now is therefore the fall of altcoin’s price with Bitcoin’s dominance climbing. That makes us ask a question of how many people will possibly dump BTC for stable currencies such as DAI. DAI is left to fluctuate, and its value is kept stable by adjusting the interest rates. It serves sort of decentralized central bank on the blockchain regulated by smart contracts. Since It’s left to fluctuations, it allows us to explore emotions of the market toward BTC. That is possible to find out by comparing the graph of DAI and BTC. Let’s start with the DAI/BTC alone and particularly with the assessment of the RSI. It’s almost impossible to oversee the huge divergence of RSI and price on the daily time frame. After the extensive fall in price in comparison to the BTC, it’s now possible that the trend will change, and as people abandon Bitcoin, the price of DAI against BTC will surge at least in the short term. In the long term though, the DAI might not bounce as strongly, will get stopped by the 150-day MA, confirming Bitcoin’s long-term bullishness. To find out how this relationship worked throughout the past, let’s continue below with the analysis of DAI/BTC compared to BTC/USD.
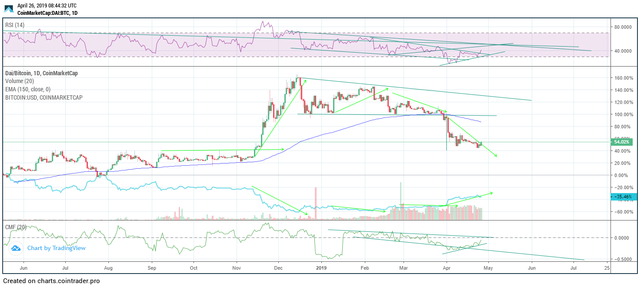
From these two graphs, divergence of the two is visible from the first moment you look at the graph. No wonder why since it’s basically inverse version of BTC/USD. You might be asking why anyone would use an inverse version of the same thing to compare it. The reason for that is visibly better possibility to asses volume on the asset with around dollar value against BTC. Additionally, it helps to look at the graph in the inverse positions to trick your brain to not be inclined to one solution. In the most cases, if one decides that asset will grow in price and at the same time decides that the inverse version of it will grow as well, it’s obvious that the mind is bullish without an objective reason. The inverse relationship is marked by the green arrows. Since DAI looks like it’s going to surge at least in the short term, it’s very likely that Bitcoin’s price against dollars will fall.
It would be a shame if all these technical developments wouldn’t be backed by fundamental reasons. News that are speculated to cause an impact on the market are the news of Tether. In Daneel, we managed to find an article with the title: “NY Attorney General sues Bitfinex and Tether to unearth “fraud being carried out” by the firms”. In a short, NY attorney general has decided to find out what is behind the secrets surrounding Bitfinex and tether. This news alone would in the bearish market cause the market to dump. From all the evidence that we have gathered through the technical analysis, it’s very likely that Bitcoin’s correction is ahead of us. If our assumption is correct, it would be smart to wait for a bounce in the altcoin prices and sell in case the push is not strong enough to recover the losses and tip the trend to the upside again. As of Bitcoin, DAI, with its recent climb in the interest rates, and other news included below, could work perfectly as a hedge against short term price fluctuations of Bitcoin. We recommend doing your own research and read about how DAI develops fundamentally. After all, reading about possibility to sell stocks for DAI in the times when stock prices rise without strong fundamental and technical reasons, is something every trader should read about. After that it’s up to you and Daneel’s artificial intelligence to decide if the fundamental changes are positive or negative.
We wish you a good luck trading and until next time, peace!
https://www.bitfinex.com/posts/356
https://go.daneel.io/news?s=ny-attorney-general-sues-bitfinex-and-tether-to-unearth-fraud-being-carried-out-by-the-firms&fbclid=IwAR1CPVo614hMtLltBmhXp6o515p2i0OJ3b4s7owbj_qT0Itn06VHYBoYzRU
https://go.daneel.io/news?s=uma-leverages-dai-stablecoin-for-access-to-us-stock-market-ethnews&fbclid=IwAR0Oi93uL2ErZzo4-iHtVfl5hWp9206v2co0QUglbqO-spDuXUDM52o7dWI
https://go.daneel.io/news?s=origin-marketplace-adds-dai-support&fbclid=IwAR3DJbz5012iyf1IiyHG3iF4rtsnV0HLInEL7iFrQ9B4agULLFiBvlsp_bg
https://go.daneel.io/news?s=makerdao-token-holders-vote-about-whether-to-raise-dai-stability-fee-by-3-&fbclid=IwAR0wBQ-ma5rNNc3zTR6g9e9T6WfN_WHHpwZy-ZL1CCCPbLmtVMwdL-STM9s