Bitcoin - Update
My previous post 7 months ago, before the start of this madness read as follows:
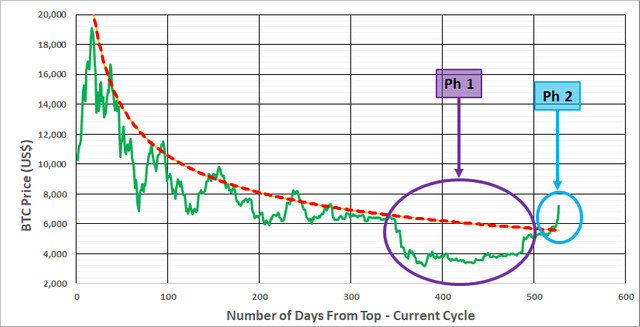
The current pump in btc is screaming for a correction as seen in the below graph. Under normal circumstances, we would have been trading sideways for at least a couple more weeks before slowly starting to increase.
Graph at the time as follows:
Update 1 was as seen below:
Update 2 was as seen below:
Update on the graph today looks like we are settling in right on target.

Previous posts:
- BTC - What's Your Take?
- The Current Bitcoin Cycle - Are You Ready?
- Bitcoin Historic Price Data
- Update on Previous Posts

Consider donating should this post have been of value:
BTC - 18atWSWrN2bDxNWeoc3Q68coQBEk69FvUY
ETH - 0x71844057eec156843af64b2b8021daf3615b0e06
LTC - LPji8igXQ1cqjhZDFZUYgEWvVshGVi4AA1


PREsearch (My referral) - https://www.presearch.org/signup?rid=454926!
Dear @dpl
Wouldn't you think that graphs and charts can be very misguiding in current days? With central banks being so heavily involved in manipulating global economy and amount of fake news being manufactured - it's hard to predict any price movement. That's at least my impression.
Yours
Piotr
Hi @crypto.piotr
Always great to hear from you man.
I was under the impression that TA is a farce. I still believe it to this day because its focus is short term. However, long term is a different story.
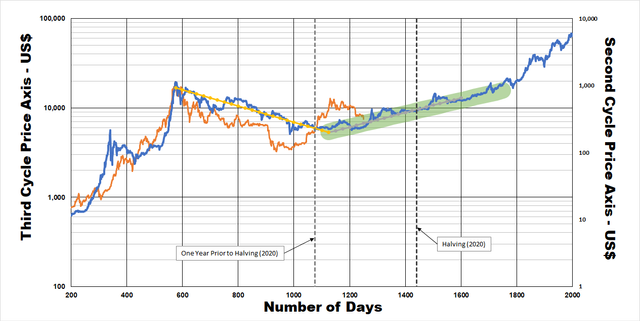
I did not get my info, from the media or some moron on youtube trying to play people but from the price itself. I've updated the second cycle (peak to peak) and it shows an almost perfect parabola over a period of three years (see image below). That's if you get red of the fluff such as the factors you speak of which in short term skews away from the trend.
I simplified the trends (on the down and on the up) as seen in the image below.
All I did in the post was to overlay the current cycle on top of the 2nd cycle (2nd cycle was the previous one where we peeked in 2017).
You will see that in some of my posts I state that the trend I present is only based on the data and it neglects the effect of increasing popularity of crypto so I like to believe it is the lower limit :-)
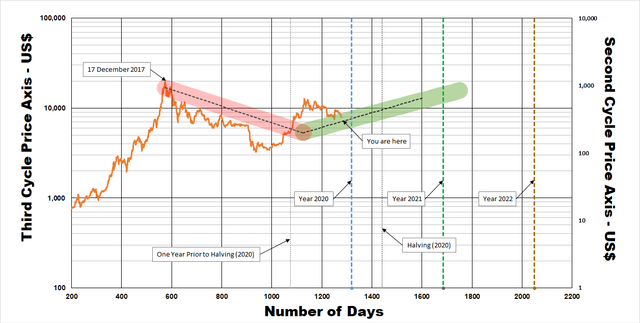
If we did not have the hash wars and Tether pump during this cycle we would have priced another perfect parabola (even better than the previous cycle). The below image probably explains it best. The transparent blue line is the previous cycle price and the dark orange line is our current pricing action. You can see that we always return to the trend line.
I agree with you that short term price prediction can only be correctly predicted on a consistent bases by people that have massive stacks of money but long term we are bound by the trends and as you can see we are right on the trend line.
Good morning @dpl
I just realized that I never thanked you for your previous comment. BIG THX! :)
ps.
Also - would you mind if I take few minutes of your time? (I hope I'm not asking this question to often ;)
Anyway .... together with few core members of project.hope team - we'te trying to promote our recent publication: an article explaining economy behind our non-profit community project build on STEEM blockchain.
Perhaps I could ask you to spare few minutes and check it out and share your feedback with me.
I would absolutely appreciate it a lot. I read all comments and I drop solid upvote on each valuable one.
Link: https://steemit.com/hive-175254/@project.hope/3-ways-of-joining-our-efforts-project-hope-economy-explained
Yours, Piotr
Congratulations @dpl! You have completed the following achievement on the Steem blockchain and have been rewarded with new badge(s) :
You can view your badges on your Steem Board and compare to others on the Steem Ranking
If you no longer want to receive notifications, reply to this comment with the word
STOPTo support your work, I also upvoted your post!
Vote for @Steemitboard as a witness to get one more award and increased upvotes!