Great update and I was looking for this (the big pic) from you for some time.
What would help to get some coordinates like for the trend line which you see must hold for the case pure bull.
Are there any other clear signals which would confirm the one or the other scenario? Any probabilities you could add to those scenarios?
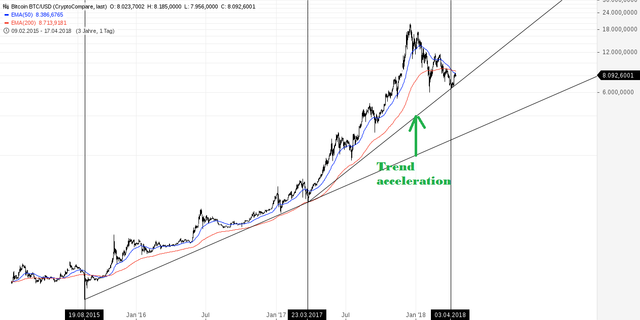
Concerning the coordinates/dates of this trendline have a look at this:
.png)
If we see 5 waves up to the level of black wave 3 (instead of 5waves up for black 1, 3waves down for black 2 and 5waves up for black 3, that would be a huge warning sign for a trend reversal.
It is a bit difficult to explain. I will draw it when the time has come.
This trendline and 6500$ are the things to keep an eye on for now.
I think I get the idea - if we overshoot that is a sign for being unsustainable.
Thanks for the big picture - Just being curious. I thought a trend line need three touch points to be considered relevant. How is your view on that?
Yes. If a trendline has 3 touch points, like the lower one, the market considers it valid. The acceleration trendline does not have three touch points yet. If wave 2 bounces off of it like I expect, then good. For now it is only a hypothetical line where I expect to find some support.