BTC TA analysis for the 4-Apr-2016
ello,
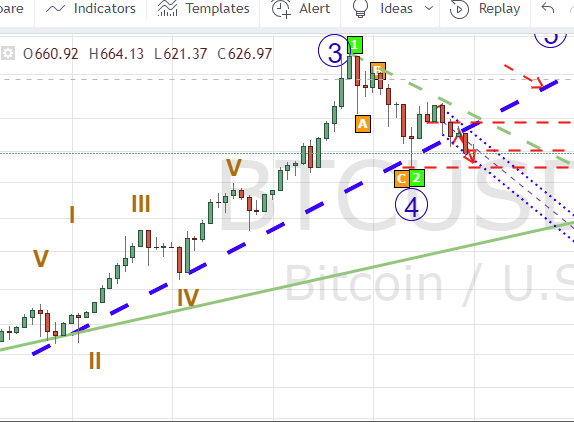
I have published the the bellow chart on 26-feb where I was expecting the price to go down to the 0.61 Fib level but as you might know the price did not stop at that level and went to .88 level
basically the .88 level that cancel my idea based on waves theory.
link for the chart:
https://www.tradingview.com/chart/BTCUSD/2bwxWcvi-BTC-Correction/
Weekly :
the current week still have a couple of days to close but it seems that bears are not as strong as the week before> i suppose that the candle will close as dogi or something in between

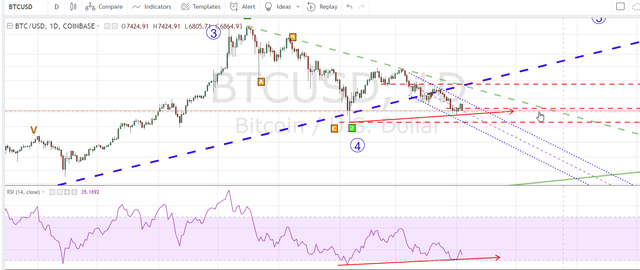
daily:
in the other hand the daily candle still has a few hours to close and it is BIG RED one that let me think that we could see the 6.4K or even a double bottom at 5.9K

Intraday:
No update