Btc
Bitcoin Price Weekly Analysis: BTC Could Rebound To $4,000
Bitcoin price formed a significant support near the $3,345 level and jumped sharply against the US Dollar.
There was a break above a crucial bearish trend line with resistance at $3,380 on the 4-hours chart of the BTC/USD pair (data feed from Kraken).
The pair rallied above the $3,400 and $3,500 resistance levels to move into a bullish zone.
Bitcoin price surged higher recently above the $3,550 barrier against the US Dollar. BTC/USD might continue to move higher towards the $3,800 and $4,000 resistance levels in the near term.
Bitcoin Price Analysis
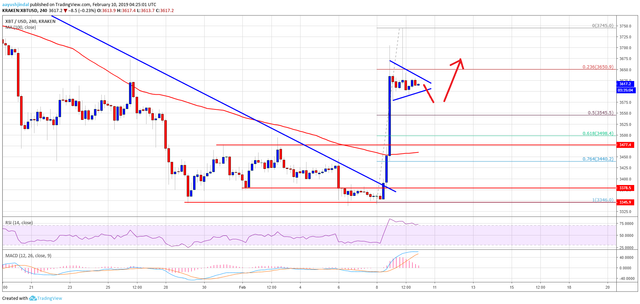
This past week, bitcoin price retested the $3,345 and $3,320 support levels against the US Dollar. The BTC/USD pair formed a strong base near the $3,345 level and later started a solid upward move. Buyers pushed the price above many resistances such as $3,380, $3,400, $3,460, $3,500 and $3,600. There was even a close above the $3,500 resistance and the 100 simple moving average (4-hours). Clearly, there was a support base formed for a much needed recovery, which could extend above $3,700.
During the rise, there was a break above a crucial bearish trend line with resistance at $3,380 on the 4-hours chart of the BTC/USD pair. The pair rallied above the $3,600 and $3,700 levels. A high was formed at $3,745 and later the price corrected lower. It traded below the 23.6% Fib retracement level of the last wave from the $3,346 low to $3,745 high. However, there are many supports on the downside, starting with $3,575. The next major support is near the $3,550 level. It represents the 50% Fib retracement level of the last wave from the $3,346 low to $3,745 high.
Looking at the chart, BTC price is clearly forming a consolidation pattern above the $3,575 support. There could be a few swing moves, but later the price might rally further above $3,750. The next key stops for buyers could be $3,800, $3,880 and $4,000 in the coming days.
Technical indicators
4-hours MACD – The MACD for BTC/USD is currently reducing its bullish slope.
4-hours RSI (Relative Strength Index) – The RSI for BTC/USD is currently well above the 70 level.
Major Support Level – $3,550
Major Resistance Level – $3,75

Posted using Partiko Android
Source
Plagiarism is the copying & pasting of others work without giving credit to the original author or artist. Plagiarized posts are considered spam.
Spam is discouraged by the community, and may result in action from the cheetah bot.
More information and tips on sharing content.
If you believe this comment is in error, please contact us in #disputes on Discord
Hi! I am a robot. I just upvoted you! I found similar content that readers might be interested in:
https://www.newsbtc.com/2019/02/10/bitcoin-price-weekly-analysis-btc-could-rebound-to-4000/