BTCUSD August 29 2019 Comperhensive Daily Update : Bear is back in town. #2
- Relating from last post about BTCUSD, this post is about the higher time frame on daily and weekly.
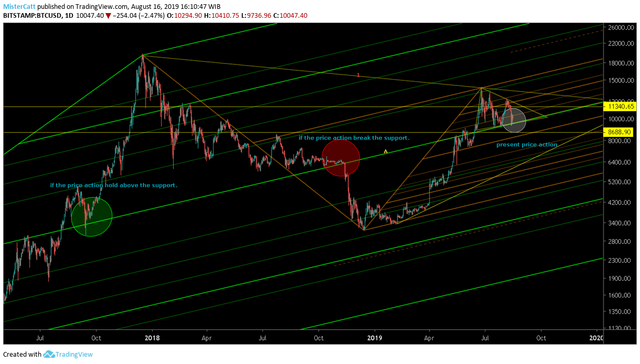
- As i said this is a crucial part of BTCUSD whether it's going to hold or bust like 2018 dump in price. See at the green bold pitchfork to see the relation with price action.
- On weekly is still bullish while it's prone toward a reversal trend.
- Daily is already on bearish trend and no significant/real sell pressure to be seen yet.
On current daily chart. it's looking serious as if the daily candlestick closes below the 9500 consecutively. Might be a bearish sign is evolve toward medium term.
From indicator itself. Bearish momentum already took a shape. Here's the brief explanation each indicator from top to bottom ;
- Stochastic RSI/RSI is below the neutral zone is bearish until somehow RSI could reach above the neutral line (white). Stochastic RSI also pointing down relating for current price downfall.
- DMI is relatively not volatile yet, -DI (red/sell power) currently dominate current trend and ADX (white/momentum strength) is still in low level), meaning there's no real sell pressure we see currently yet.
- OBV is decrease a volume from the market, sign of smart money leaving this current market, if this continue making lower low would be bad for BTCUSD price level.
.png)
On Weekly still bullish yet it's all depend on how the daily price action react, Here's the brief explanation of each indicator from top to bottom ;
- Stochastic RSI/RSI is still on bullish side but currently, Stochastic RSI is leaning bearish as it's moving down, so far both of it still above the neutral zone (white line), i'll be bearish completely if both of it below the neutral zone.
- DMI shape is very intimidating as +DI (green/buy power) and -DI (red/sell power) ready to intersect with each other. Sign of reversal/volatile market is took a shape and ADX is on a strong level.
- OBV still bullish level while it's took a pattern of bearish posture as it's keep making a higher low. if this is kept going decrease, might as well seeing a heavy bearish trend in long term.
.png)
Thank you for your time to read this post and please take this idea as a grain of salt as reality always differ from what i expect as this post merely just an opinion.
and please feel free to share what your thought on comment section.
peace.